Subsaharan African vs Immigrants from Burma/Myanmar Seniors Poverty Over the Age of 65
COMPARE
Subsaharan African
Immigrants from Burma/Myanmar
Seniors Poverty Over the Age of 65
Seniors Poverty Over the Age of 65 Comparison
Sub-Saharan Africans
Immigrants from Burma/Myanmar
12.1%
SENIORS POVERTY OVER THE AGE OF 65
0.9/ 100
METRIC RATING
242nd/ 347
METRIC RANK
11.3%
SENIORS POVERTY OVER THE AGE OF 65
21.3/ 100
METRIC RATING
198th/ 347
METRIC RANK
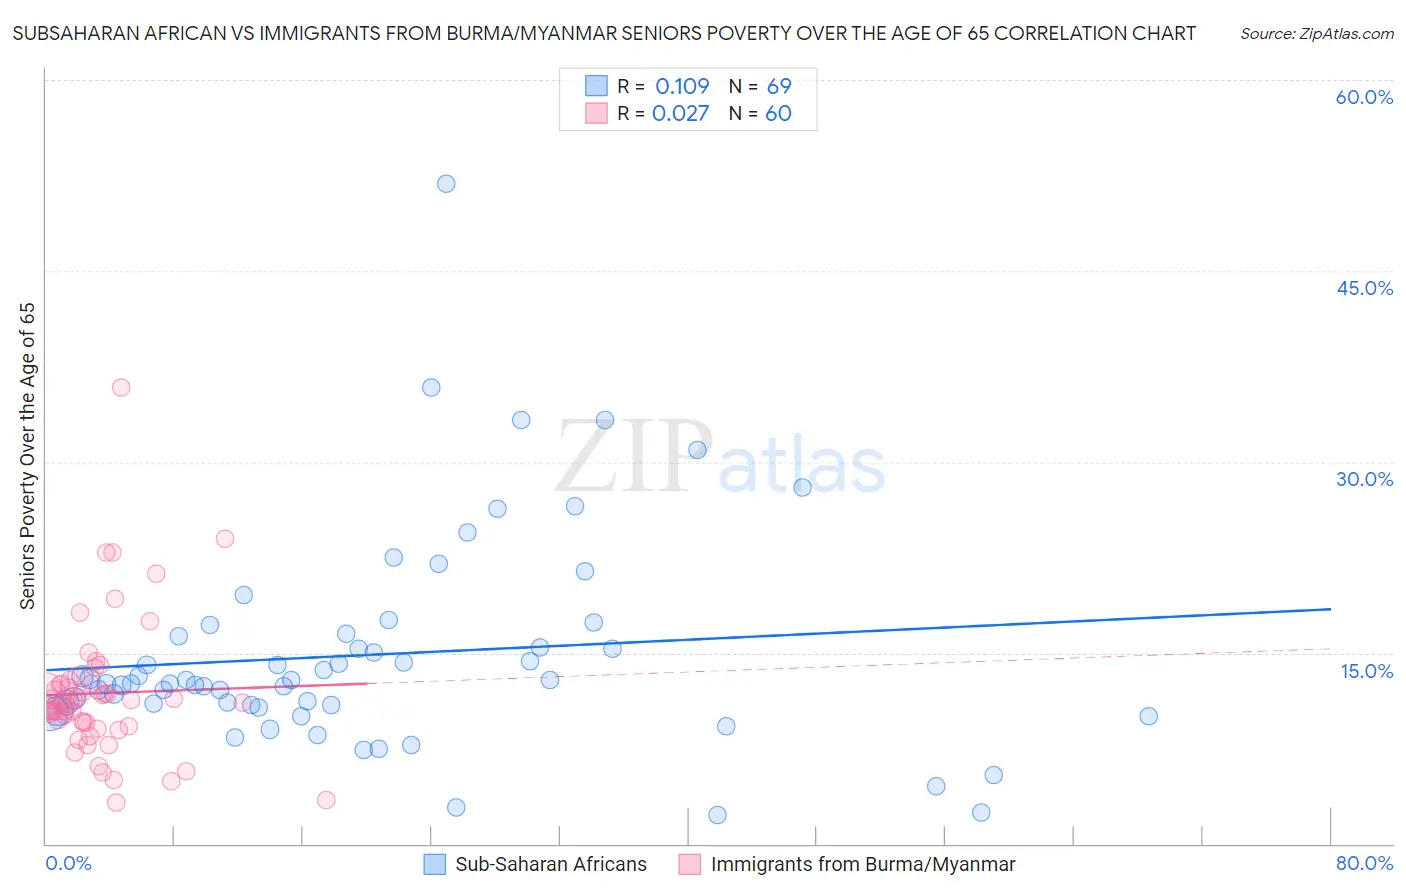
Subsaharan African vs Immigrants from Burma/Myanmar Seniors Poverty Over the Age of 65 Correlation Chart
The statistical analysis conducted on geographies consisting of 505,238,061 people shows a poor positive correlation between the proportion of Sub-Saharan Africans and poverty level among seniors over the age of 65 in the United States with a correlation coefficient (R) of 0.109 and weighted average of 12.1%. Similarly, the statistical analysis conducted on geographies consisting of 172,103,191 people shows no correlation between the proportion of Immigrants from Burma/Myanmar and poverty level among seniors over the age of 65 in the United States with a correlation coefficient (R) of 0.027 and weighted average of 11.3%, a difference of 7.3%.
Seniors Poverty Over the Age of 65 Correlation Summary
| Measurement | Subsaharan African | Immigrants from Burma/Myanmar |
| Minimum | 2.2% | 3.2% |
| Maximum | 51.9% | 35.9% |
| Range | 49.6% | 32.6% |
| Mean | 14.8% | 11.8% |
| Median | 12.6% | 11.1% |
| Interquartile 25% (IQ1) | 10.8% | 9.4% |
| Interquartile 75% (IQ3) | 16.4% | 12.6% |
| Interquartile Range (IQR) | 5.6% | 3.2% |
| Standard Deviation (Sample) | 8.4% | 5.4% |
| Standard Deviation (Population) | 8.3% | 5.3% |
Similar Demographics by Seniors Poverty Over the Age of 65
Demographics Similar to Sub-Saharan Africans by Seniors Poverty Over the Age of 65
In terms of seniors poverty over the age of 65, the demographic groups most similar to Sub-Saharan Africans are Immigrants from Albania (12.1%, a difference of 0.040%), Comanche (12.1%, a difference of 0.060%), Uruguayan (12.1%, a difference of 0.12%), Immigrants from Spain (12.1%, a difference of 0.16%), and Immigrants from Portugal (12.1%, a difference of 0.34%).
| Demographics | Rating | Rank | Seniors Poverty Over the Age of 65 |
| Immigrants | Argentina | 1.3 /100 | #235 | Tragic 12.0% |
| Immigrants | Peru | 1.3 /100 | #236 | Tragic 12.0% |
| Moroccans | 1.2 /100 | #237 | Tragic 12.0% |
| Seminole | 1.1 /100 | #238 | Tragic 12.0% |
| Immigrants | Spain | 1.0 /100 | #239 | Tragic 12.1% |
| Comanche | 0.9 /100 | #240 | Tragic 12.1% |
| Immigrants | Albania | 0.9 /100 | #241 | Tragic 12.1% |
| Sub-Saharan Africans | 0.9 /100 | #242 | Tragic 12.1% |
| Uruguayans | 0.8 /100 | #243 | Tragic 12.1% |
| Immigrants | Portugal | 0.8 /100 | #244 | Tragic 12.1% |
| Chippewa | 0.7 /100 | #245 | Tragic 12.1% |
| Cree | 0.7 /100 | #246 | Tragic 12.1% |
| Japanese | 0.6 /100 | #247 | Tragic 12.2% |
| Spanish Americans | 0.6 /100 | #248 | Tragic 12.2% |
| Ute | 0.6 /100 | #249 | Tragic 12.2% |
Demographics Similar to Immigrants from Burma/Myanmar by Seniors Poverty Over the Age of 65
In terms of seniors poverty over the age of 65, the demographic groups most similar to Immigrants from Burma/Myanmar are Immigrants from Israel (11.3%, a difference of 0.13%), Alsatian (11.3%, a difference of 0.16%), Albanian (11.2%, a difference of 0.38%), Bangladeshi (11.2%, a difference of 0.47%), and Immigrants from Brazil (11.3%, a difference of 0.48%).
| Demographics | Rating | Rank | Seniors Poverty Over the Age of 65 |
| Immigrants | Uganda | 32.2 /100 | #191 | Fair 11.1% |
| Immigrants | Southern Europe | 30.1 /100 | #192 | Fair 11.1% |
| Taiwanese | 29.2 /100 | #193 | Fair 11.2% |
| Chileans | 27.8 /100 | #194 | Fair 11.2% |
| Immigrants | Vietnam | 26.6 /100 | #195 | Fair 11.2% |
| Bangladeshis | 25.2 /100 | #196 | Fair 11.2% |
| Albanians | 24.4 /100 | #197 | Fair 11.2% |
| Immigrants | Burma/Myanmar | 21.3 /100 | #198 | Fair 11.3% |
| Immigrants | Israel | 20.3 /100 | #199 | Fair 11.3% |
| Alsatians | 20.1 /100 | #200 | Fair 11.3% |
| Immigrants | Brazil | 17.8 /100 | #201 | Poor 11.3% |
| Costa Ricans | 17.0 /100 | #202 | Poor 11.3% |
| Immigrants | Zaire | 16.9 /100 | #203 | Poor 11.3% |
| Israelis | 16.5 /100 | #204 | Poor 11.3% |
| Brazilians | 15.4 /100 | #205 | Poor 11.3% |