Black/African American vs Immigrants from Burma/Myanmar Unemployment Among Ages 16 to 19 years
COMPARE
Black/African American
Immigrants from Burma/Myanmar
Unemployment Among Ages 16 to 19 years
Unemployment Among Ages 16 to 19 years Comparison
Blacks/African Americans
Immigrants from Burma/Myanmar
21.4%
UNEMPLOYMENT AMONG AGES 16 TO 19 YEARS
0.0/ 100
METRIC RATING
307th/ 347
METRIC RANK
15.6%
UNEMPLOYMENT AMONG AGES 16 TO 19 YEARS
100.0/ 100
METRIC RATING
13th/ 347
METRIC RANK
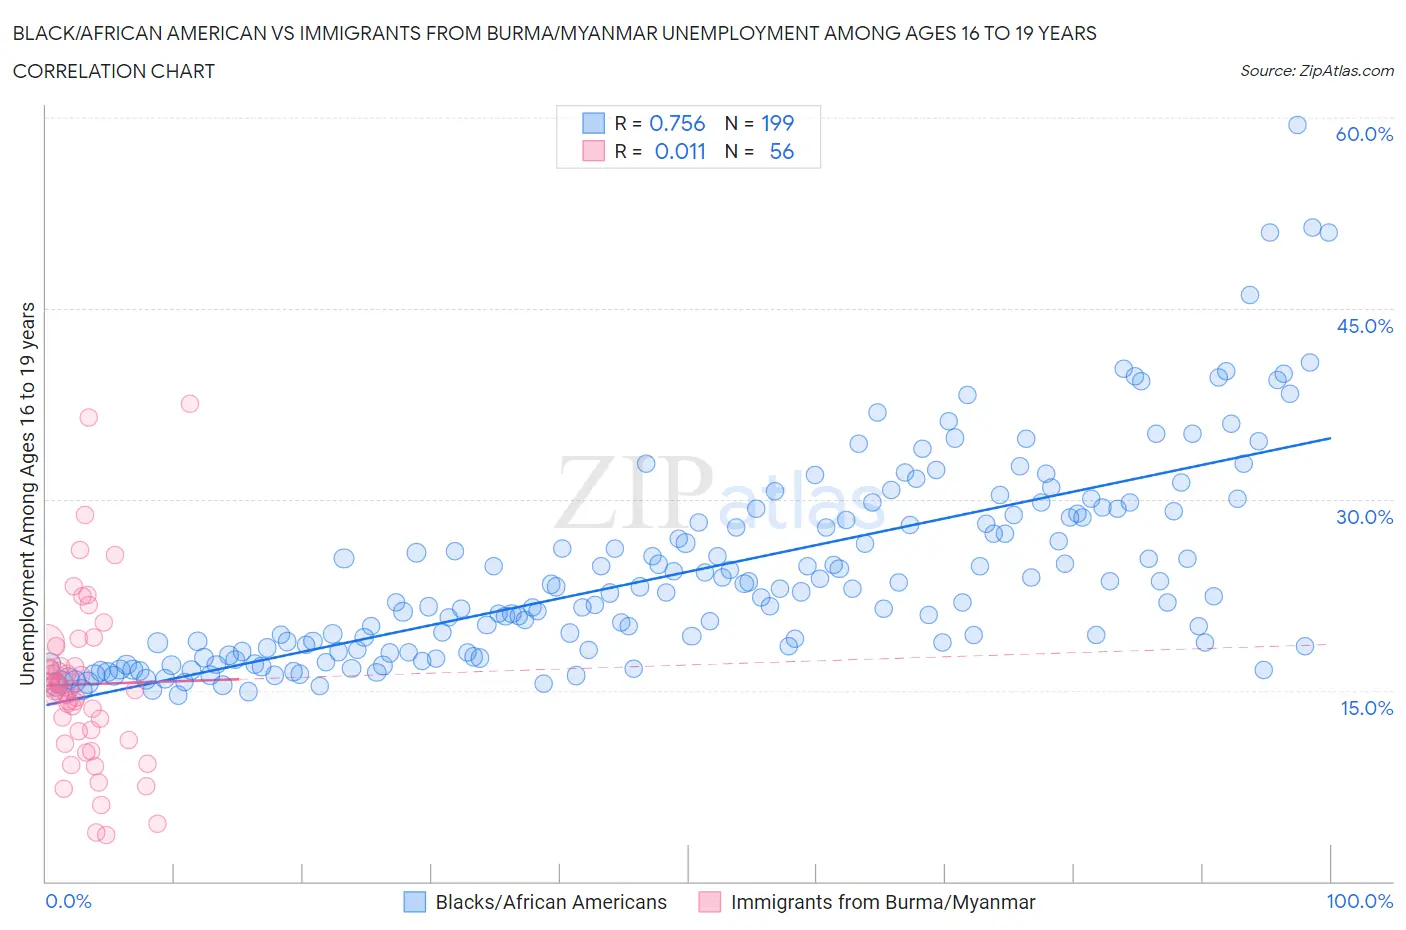
Black/African American vs Immigrants from Burma/Myanmar Unemployment Among Ages 16 to 19 years Correlation Chart
The statistical analysis conducted on geographies consisting of 508,068,694 people shows a strong positive correlation between the proportion of Blacks/African Americans and unemployment rate among population between the ages 16 and 19 in the United States with a correlation coefficient (R) of 0.756 and weighted average of 21.4%. Similarly, the statistical analysis conducted on geographies consisting of 168,780,503 people shows no correlation between the proportion of Immigrants from Burma/Myanmar and unemployment rate among population between the ages 16 and 19 in the United States with a correlation coefficient (R) of 0.011 and weighted average of 15.6%, a difference of 37.2%.
Unemployment Among Ages 16 to 19 years Correlation Summary
| Measurement | Black/African American | Immigrants from Burma/Myanmar |
| Minimum | 14.6% | 3.6% |
| Maximum | 59.4% | 37.5% |
| Range | 44.7% | 33.9% |
| Mean | 24.3% | 15.5% |
| Median | 22.4% | 15.0% |
| Interquartile 25% (IQ1) | 18.0% | 11.5% |
| Interquartile 75% (IQ3) | 28.6% | 17.7% |
| Interquartile Range (IQR) | 10.6% | 6.3% |
| Standard Deviation (Sample) | 8.0% | 6.8% |
| Standard Deviation (Population) | 8.0% | 6.7% |
Similar Demographics by Unemployment Among Ages 16 to 19 years
Demographics Similar to Blacks/African Americans by Unemployment Among Ages 16 to 19 years
In terms of unemployment among ages 16 to 19 years, the demographic groups most similar to Blacks/African Americans are Immigrants from Bangladesh (21.5%, a difference of 0.38%), Native/Alaskan (21.5%, a difference of 0.54%), U.S. Virgin Islander (21.3%, a difference of 0.58%), Vietnamese (21.5%, a difference of 0.60%), and Belizean (21.6%, a difference of 0.82%).
| Demographics | Rating | Rank | Unemployment Among Ages 16 to 19 years |
| Ecuadorians | 0.0 /100 | #300 | Tragic 20.5% |
| Immigrants | Ecuador | 0.0 /100 | #301 | Tragic 20.9% |
| Immigrants | Caribbean | 0.0 /100 | #302 | Tragic 20.9% |
| Senegalese | 0.0 /100 | #303 | Tragic 21.0% |
| Aleuts | 0.0 /100 | #304 | Tragic 21.2% |
| Immigrants | Senegal | 0.0 /100 | #305 | Tragic 21.2% |
| U.S. Virgin Islanders | 0.0 /100 | #306 | Tragic 21.3% |
| Blacks/African Americans | 0.0 /100 | #307 | Tragic 21.4% |
| Immigrants | Bangladesh | 0.0 /100 | #308 | Tragic 21.5% |
| Natives/Alaskans | 0.0 /100 | #309 | Tragic 21.5% |
| Vietnamese | 0.0 /100 | #310 | Tragic 21.5% |
| Belizeans | 0.0 /100 | #311 | Tragic 21.6% |
| Houma | 0.0 /100 | #312 | Tragic 21.6% |
| Jamaicans | 0.0 /100 | #313 | Tragic 21.7% |
| Alaska Natives | 0.0 /100 | #314 | Tragic 21.8% |
Demographics Similar to Immigrants from Burma/Myanmar by Unemployment Among Ages 16 to 19 years
In terms of unemployment among ages 16 to 19 years, the demographic groups most similar to Immigrants from Burma/Myanmar are Immigrants from Zaire (15.6%, a difference of 0.14%), Yugoslavian (15.6%, a difference of 0.20%), Taiwanese (15.5%, a difference of 0.43%), German (15.7%, a difference of 0.49%), and Indonesian (15.5%, a difference of 0.53%).
| Demographics | Rating | Rank | Unemployment Among Ages 16 to 19 years |
| Swedes | 100.0 /100 | #6 | Exceptional 15.3% |
| Immigrants | Bosnia and Herzegovina | 100.0 /100 | #7 | Exceptional 15.3% |
| Czechs | 100.0 /100 | #8 | Exceptional 15.4% |
| Scandinavians | 100.0 /100 | #9 | Exceptional 15.4% |
| Zimbabweans | 100.0 /100 | #10 | Exceptional 15.4% |
| Indonesians | 100.0 /100 | #11 | Exceptional 15.5% |
| Taiwanese | 100.0 /100 | #12 | Exceptional 15.5% |
| Immigrants | Burma/Myanmar | 100.0 /100 | #13 | Exceptional 15.6% |
| Immigrants | Zaire | 100.0 /100 | #14 | Exceptional 15.6% |
| Yugoslavians | 100.0 /100 | #15 | Exceptional 15.6% |
| Germans | 100.0 /100 | #16 | Exceptional 15.7% |
| Somalis | 100.0 /100 | #17 | Exceptional 15.7% |
| Thais | 100.0 /100 | #18 | Exceptional 15.7% |
| Swiss | 100.0 /100 | #19 | Exceptional 15.8% |
| Sudanese | 100.0 /100 | #20 | Exceptional 15.8% |