Subsaharan African vs Immigrants from Micronesia Unemployment Among Ages 16 to 19 years

COMPARE

Subsaharan African
Race
Ancestry
AfghanAfricanAlaska NativeAlaskan AthabascanAlbanianAleutAlsatianAmericanApacheArabArapahoArgentineanArmenianAssyrian/Chaldean/SyriacAustralianAustrianBahamianBangladeshiBarbadianBasqueBelgianBelizeanBermudanBhutaneseBlackfeetBolivianBrazilianBritishBritish West IndianBulgarianBurmeseCajunCambodianCanadianCape VerdeanCarpatho RusynCelticCentral AmericanCentral American IndianCherokeeCheyenneChickasawChileanChineseChippewaChoctawColombianColvilleComancheCosta RicanCreeCreekCroatianCrowCubanCypriotCzechCzechoslovakianDanishDelawareDominicanDutchDutch West IndianEastern EuropeanEcuadorianEgyptianEnglishEstonianEthiopianEuropeanFijianFilipinoFinnishFrenchFrench American IndianFrench CanadianGermanGerman RussianGhanaianGreekGuamanian/ChamorroGuatemalanGuyaneseHaitianHmongHonduranHopiHoumaHungarianIcelanderIndian (Asian)IndonesianInupiatIranianIraqiIrishIroquoisIsraeliItalianJamaicanJapaneseJordanianKenyanKiowaKoreanLaotianLatvianLebaneseLiberianLithuanianLumbeeLuxembourgerMacedonianMalaysianMalteseMarshalleseMenomineeMexicanMexican American IndianMongolianMoroccanNative HawaiianNavajoNepaleseNew ZealanderNicaraguanNigerianNorthern EuropeanNorwegianOkinawanOsageOttawaPaiutePakistaniPalestinianPanamanianParaguayanPennsylvania GermanPeruvianPimaPolishPortuguesePotawatomiPuebloPuerto RicanPuget Sound SalishRomanianRussianSalvadoranSamoanScandinavianScotch-IrishScottishSeminoleSenegaleseSerbianShoshoneSierra LeoneanSiouxSlavicSlovakSloveneSomaliSouth AfricanSouth AmericanSouth American IndianSoviet UnionSpaniardSpanishSpanish AmericanSpanish American IndianSri LankanSubsaharan AfricanSudaneseSwedishSwissSyrianTaiwaneseThaiTlingit-HaidaTohono O'OdhamTonganTrinidadian and TobagonianTsimshianTurkishU.S. Virgin IslanderUgandanUkrainianUruguayanUteVenezuelanVietnameseWelshWest IndianYakamaYaquiYugoslavianYumanYup'ikZimbabwean
Immigration
NonimmigrantsImmigrantsAfghanistanAfricaAlbaniaArgentinaArmeniaAsiaAustraliaAustriaBahamasBangladeshBarbadosBelarusBelgiumBelizeBoliviaBosnia and HerzegovinaBrazilBulgariaBurma/MyanmarCabo VerdeCambodiaCameroonCanadaCaribbeanCentral AmericaChileChinaColombiaCongoCosta RicaCroatiaCubaCzechoslovakiaDenmarkDominicaDominican RepublicEastern AfricaEastern AsiaEastern EuropeEcuadorEgyptEl SalvadorEnglandEritreaEthiopiaEuropeFijiFranceGermanyGhanaGreeceGrenadaGuatemalaGuyanaHaitiHondurasHong KongHungaryIndiaIndonesiaIranIraqIrelandIsraelItalyJamaicaJapanJordanKazakhstanKenyaKoreaKuwaitLaosLatin AmericaLatviaLebanonLiberiaLithuaniaMalaysiaMexicoMiddle AfricaMoldovaMoroccoNepalNetherlandsNicaraguaNigeriaNorth AmericaNorth MacedoniaNorthern AfricaNorthern EuropeNorwayOceaniaPakistanPanamaPeruPhilippinesPolandPortugalRomaniaRussiaSaudi ArabiaScotlandSenegalSerbiaSierra LeoneSingaporeSomaliaSouth AfricaSouth AmericaSouth Central AsiaSouth Eastern AsiaSouthern EuropeSpainSri LankaSt. Vincent and the GrenadinesSudanSwedenSwitzerlandSyriaTaiwanThailandTrinidad and TobagoTurkeyUgandaUkraineUruguayUzbekistanVenezuelaVietnamWest IndiesWestern AfricaWestern AsiaWestern EuropeYemenZaireZimbabweAzores
Immigrants from Micronesia
Race
Ancestry
AfghanAfricanAlaska NativeAlaskan AthabascanAlbanianAleutAlsatianAmericanApacheArabArapahoArgentineanArmenianAssyrian/Chaldean/SyriacAustralianAustrianBahamianBangladeshiBarbadianBasqueBelgianBelizeanBermudanBhutaneseBlackfeetBolivianBrazilianBritishBritish West IndianBulgarianBurmeseCajunCambodianCanadianCape VerdeanCarpatho RusynCelticCentral AmericanCentral American IndianCherokeeCheyenneChickasawChileanChineseChippewaChoctawColombianColvilleComancheCosta RicanCreeCreekCroatianCrowCubanCypriotCzechCzechoslovakianDanishDelawareDominicanDutchDutch West IndianEastern EuropeanEcuadorianEgyptianEnglishEstonianEthiopianEuropeanFijianFilipinoFinnishFrenchFrench American IndianFrench CanadianGermanGerman RussianGhanaianGreekGuamanian/ChamorroGuatemalanGuyaneseHaitianHmongHonduranHopiHoumaHungarianIcelanderIndian (Asian)IndonesianInupiatIranianIraqiIrishIroquoisIsraeliItalianJamaicanJapaneseJordanianKenyanKiowaKoreanLaotianLatvianLebaneseLiberianLithuanianLumbeeLuxembourgerMacedonianMalaysianMalteseMarshalleseMenomineeMexicanMexican American IndianMongolianMoroccanNative HawaiianNavajoNepaleseNew ZealanderNicaraguanNigerianNorthern EuropeanNorwegianOkinawanOsageOttawaPaiutePakistaniPalestinianPanamanianParaguayanPennsylvania GermanPeruvianPimaPolishPortuguesePotawatomiPuebloPuerto RicanPuget Sound SalishRomanianRussianSalvadoranSamoanScandinavianScotch-IrishScottishSeminoleSenegaleseSerbianShoshoneSierra LeoneanSiouxSlavicSlovakSloveneSomaliSouth AfricanSouth AmericanSouth American IndianSoviet UnionSpaniardSpanishSpanish AmericanSpanish American IndianSri LankanSudaneseSwedishSwissSyrianTaiwaneseThaiTlingit-HaidaTohono O'OdhamTonganTrinidadian and TobagonianTsimshianTurkishU.S. Virgin IslanderUgandanUkrainianUruguayanUteVenezuelanVietnameseWelshWest IndianYakamaYaquiYugoslavianYumanYup'ikZimbabwean
Immigration
NonimmigrantsImmigrantsAfghanistanAfricaAlbaniaArgentinaArmeniaAsiaAustraliaAustriaBahamasBangladeshBarbadosBelarusBelgiumBelizeBoliviaBosnia and HerzegovinaBrazilBulgariaBurma/MyanmarCabo VerdeCambodiaCameroonCanadaCaribbeanCentral AmericaChileChinaColombiaCongoCosta RicaCroatiaCubaCzechoslovakiaDenmarkDominicaDominican RepublicEastern AfricaEastern AsiaEastern EuropeEcuadorEgyptEl SalvadorEnglandEritreaEthiopiaEuropeFijiFranceGermanyGhanaGreeceGrenadaGuatemalaGuyanaHaitiHondurasHong KongHungaryIndiaIndonesiaIranIraqIrelandIsraelItalyJamaicaJapanJordanKazakhstanKenyaKoreaKuwaitLaosLatin AmericaLatviaLebanonLiberiaLithuaniaMalaysiaMexicoMicronesiaMiddle AfricaMoldovaMoroccoNepalNetherlandsNicaraguaNigeriaNorth AmericaNorth MacedoniaNorthern AfricaNorthern EuropeNorwayOceaniaPakistanPanamaPeruPhilippinesPolandPortugalRomaniaRussiaSaudi ArabiaScotlandSenegalSerbiaSierra LeoneSingaporeSomaliaSouth AfricaSouth AmericaSouth Central AsiaSouth Eastern AsiaSouthern EuropeSpainSri LankaSt. Vincent and the GrenadinesSudanSwedenSwitzerlandSyriaTaiwanThailandTrinidad and TobagoTurkeyUgandaUkraineUruguayUzbekistanVenezuelaVietnamWest IndiesWestern AfricaWestern AsiaWestern EuropeYemenZaireZimbabweAzores
Unemployment Among Ages 16 to 19 years
Income
Poverty
Unemployment
Labor Participation
Family Structure
Vehicle Availability
Education Level
Disability

Unemployment Among Ages 16 to 19 years Comparison

Sub-Saharan Africans

Immigrants from Micronesia

Tragic
Average
18.7%
UNEMPLOYMENT AMONG AGES 16 TO 19 YEARS
0.4/ 100
METRIC RATING
251st/ 347
METRIC RANK
17.6%
UNEMPLOYMENT AMONG AGES 16 TO 19 YEARS
42.4/ 100
METRIC RATING
187th/ 347
METRIC RANK

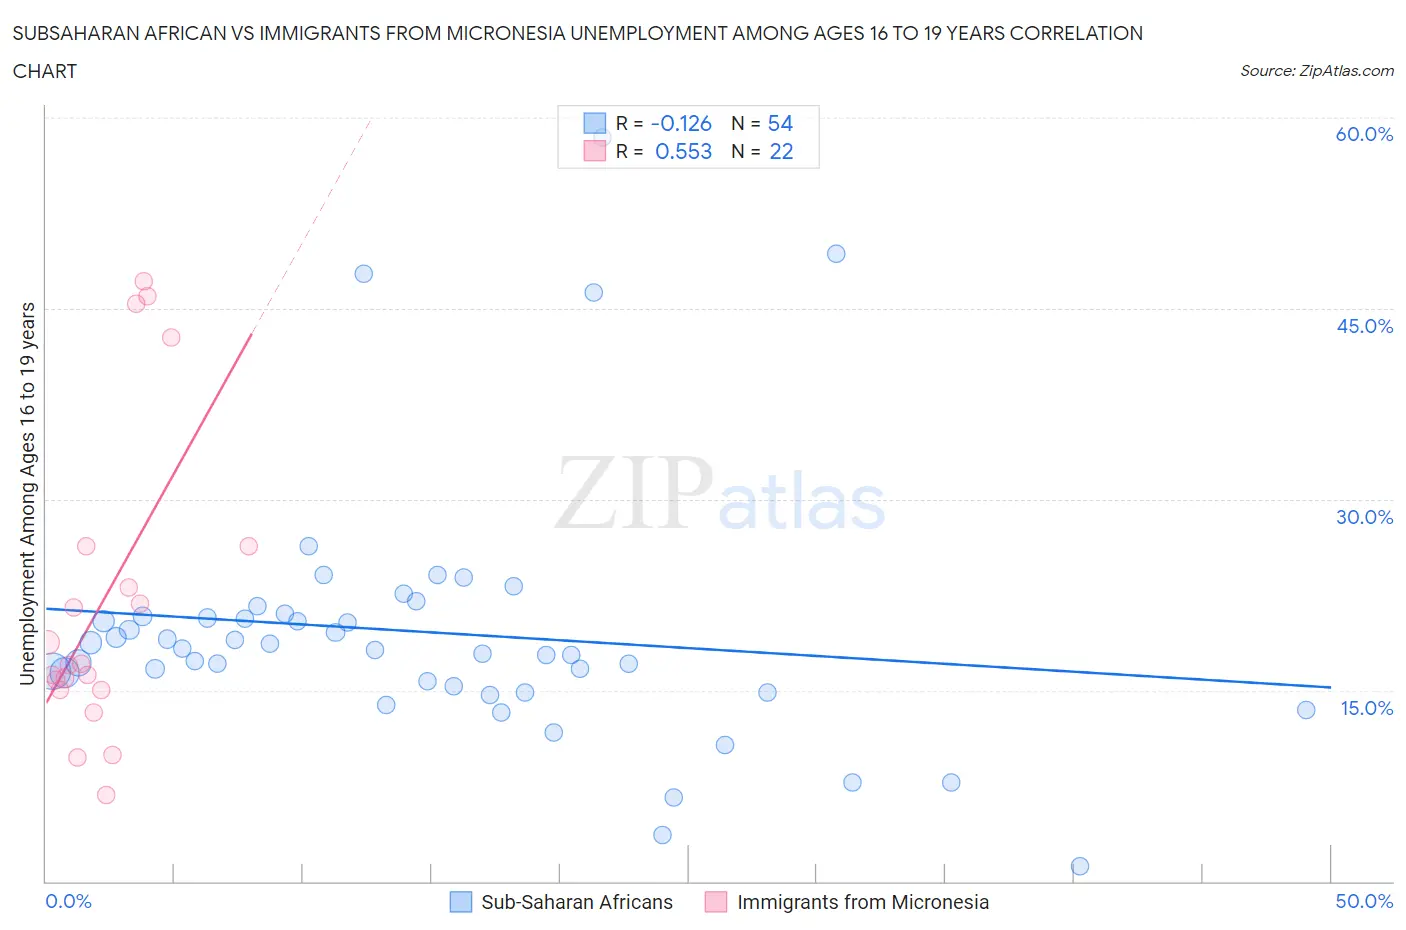
Subsaharan African vs Immigrants from Micronesia Unemployment Among Ages 16 to 19 years Correlation Chart

The statistical analysis conducted on geographies consisting of 472,169,930 people shows a poor negative correlation between the proportion of Sub-Saharan Africans and unemployment rate among population between the ages 16 and 19 in the United States with a correlation coefficient (R) of -0.126 and weighted average of 18.7%. Similarly, the statistical analysis conducted on geographies consisting of 60,570,430 people shows a substantial positive correlation between the proportion of Immigrants from Micronesia and unemployment rate among population between the ages 16 and 19 in the United States with a correlation coefficient (R) of 0.553 and weighted average of 17.6%, a difference of 6.2%.
Subsaharan African vs Immigrants from Micronesia Unemployment Among Ages 16 to 19 years

Unemployment Among Ages 16 to 19 years Correlation Summary

MeasurementSubsaharan AfricanImmigrants from Micronesia
Minimum1.2%6.8%
Maximum58.4%47.1%
Range57.2%40.3%
Mean19.6%22.1%
Median18.2%17.0%
Interquartile 25% (IQ1)15.3%15.0%
Interquartile 75% (IQ3)20.8%26.3%
Interquartile Range (IQR)5.5%11.3%
Standard Deviation (Sample)10.2%12.2%
Standard Deviation (Population)10.1%11.9%

Similar Demographics by Unemployment Among Ages 16 to 19 years

Demographics Similar to Sub-Saharan Africans by Unemployment Among Ages 16 to 19 years

In terms of unemployment among ages 16 to 19 years, the demographic groups most similar to Sub-Saharan Africans are Immigrants from Guatemala (18.7%, a difference of 0.030%), Panamanian (18.7%, a difference of 0.11%), Puget Sound Salish (18.7%, a difference of 0.22%), Delaware (18.7%, a difference of 0.28%), and Immigrants from Israel (18.7%, a difference of 0.31%).
DemographicsRating | RankUnemployment Among Ages 16 to 19 years
Guatemalans
0.8
/100
|
#244
Tragic
18.6%
Immigrants | Belarus
0.8
/100
|
#245
Tragic
18.6%
Immigrants | South America
0.5
/100
|
#246
Tragic
18.7%
Immigrants | Israel
0.5
/100
|
#247
Tragic
18.7%
Delaware
0.5
/100
|
#248
Tragic
18.7%
Puget Sound Salish
0.5
/100
|
#249
Tragic
18.7%
Panamanians
0.4
/100
|
#250
Tragic
18.7%
Sub-Saharan Africans
0.4
/100
|
#251
Tragic
18.7%
Immigrants | Guatemala
0.4
/100
|
#252
Tragic
18.7%
Central Americans
0.3
/100
|
#253
Tragic
18.8%
Apache
0.3
/100
|
#254
Tragic
18.8%
Immigrants | Cameroon
0.3
/100
|
#255
Tragic
18.8%
Mexican American Indians
0.3
/100
|
#256
Tragic
18.8%
Immigrants | Nigeria
0.2
/100
|
#257
Tragic
18.9%
Immigrants | Mexico
0.2
/100
|
#258
Tragic
18.9%

Demographics Similar to Immigrants from Micronesia by Unemployment Among Ages 16 to 19 years

In terms of unemployment among ages 16 to 19 years, the demographic groups most similar to Immigrants from Micronesia are Immigrants from Nicaragua (17.6%, a difference of 0.010%), Immigrants from Europe (17.6%, a difference of 0.030%), Marshallese (17.6%, a difference of 0.030%), Japanese (17.6%, a difference of 0.040%), and Iroquois (17.6%, a difference of 0.050%).
DemographicsRating | RankUnemployment Among Ages 16 to 19 years
Spaniards
47.1
/100
|
#180
Average
17.6%
Immigrants | Turkey
45.6
/100
|
#181
Average
17.6%
Russians
45.2
/100
|
#182
Average
17.6%
Immigrants | Uruguay
44.6
/100
|
#183
Average
17.6%
Eastern Europeans
44.3
/100
|
#184
Average
17.6%
Iroquois
43.4
/100
|
#185
Average
17.6%
Japanese
43.2
/100
|
#186
Average
17.6%
Immigrants | Micronesia
42.4
/100
|
#187
Average
17.6%
Immigrants | Nicaragua
42.2
/100
|
#188
Average
17.6%
Immigrants | Europe
41.8
/100
|
#189
Average
17.6%
Marshallese
41.7
/100
|
#190
Average
17.6%
Immigrants | Costa Rica
41.3
/100
|
#191
Average
17.6%
Immigrants | Philippines
40.7
/100
|
#192
Average
17.7%
Immigrants | Australia
40.6
/100
|
#193
Average
17.7%
Peruvians
38.8
/100
|
#194
Fair
17.7%