Blackfeet vs Immigrants from Kuwait Male Unemployment
COMPARE
Blackfeet
Immigrants from Kuwait
Male Unemployment
Male Unemployment Comparison
Blackfeet
Immigrants from Kuwait
6.0%
MALE UNEMPLOYMENT
0.0/ 100
METRIC RATING
271st/ 347
METRIC RANK
5.1%
MALE UNEMPLOYMENT
93.3/ 100
METRIC RATING
98th/ 347
METRIC RANK
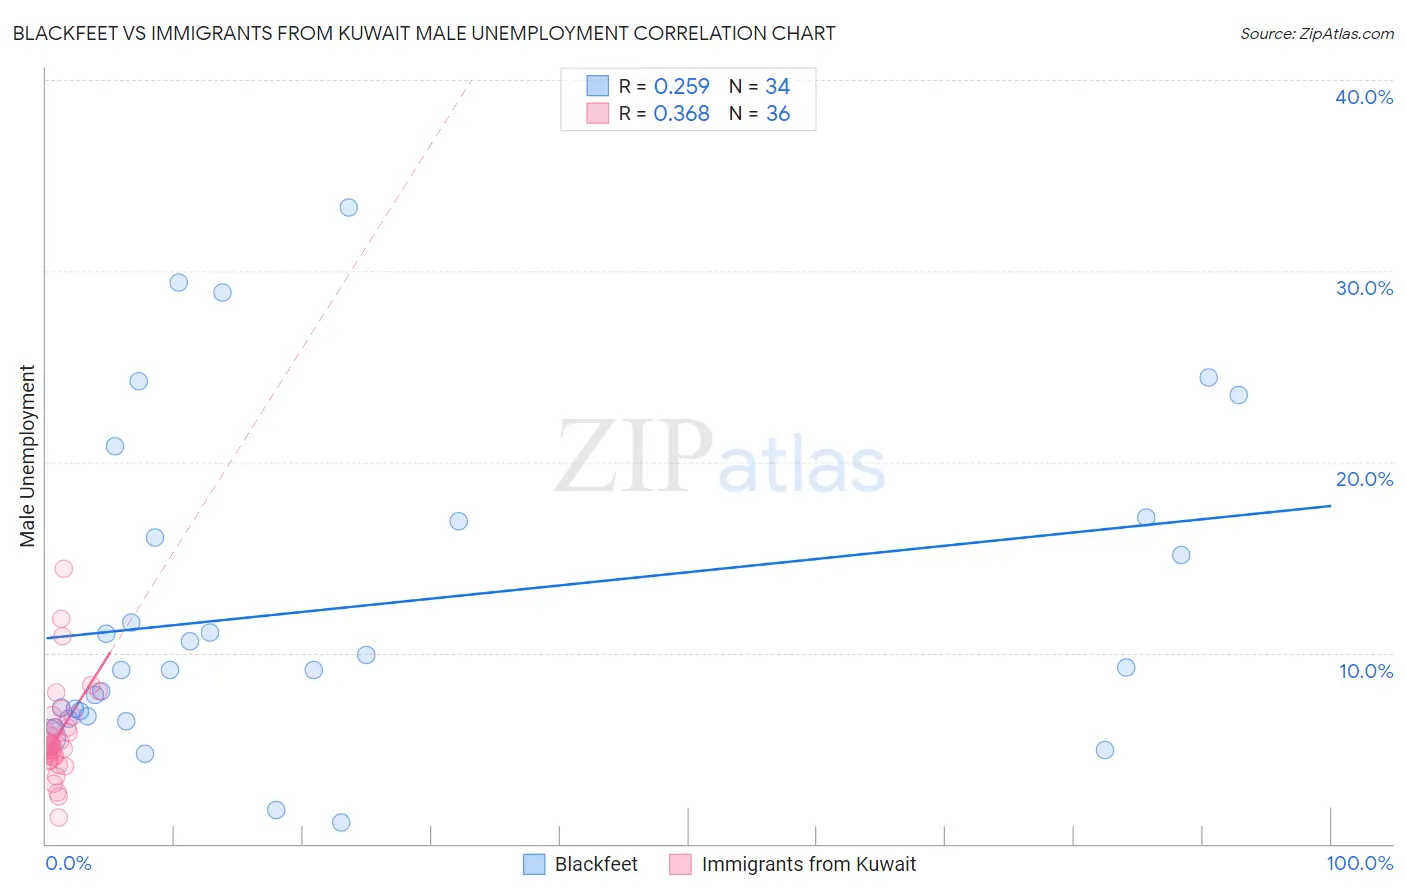
Blackfeet vs Immigrants from Kuwait Male Unemployment Correlation Chart
The statistical analysis conducted on geographies consisting of 308,278,150 people shows a weak positive correlation between the proportion of Blackfeet and unemployment rate among males in the United States with a correlation coefficient (R) of 0.259 and weighted average of 6.0%. Similarly, the statistical analysis conducted on geographies consisting of 136,850,948 people shows a mild positive correlation between the proportion of Immigrants from Kuwait and unemployment rate among males in the United States with a correlation coefficient (R) of 0.368 and weighted average of 5.1%, a difference of 17.7%.
Male Unemployment Correlation Summary
| Measurement | Blackfeet | Immigrants from Kuwait |
| Minimum | 1.1% | 1.4% |
| Maximum | 33.3% | 14.4% |
| Range | 32.2% | 13.0% |
| Mean | 12.4% | 5.7% |
| Median | 9.2% | 5.1% |
| Interquartile 25% (IQ1) | 6.7% | 4.5% |
| Interquartile 75% (IQ3) | 16.9% | 6.4% |
| Interquartile Range (IQR) | 10.2% | 1.9% |
| Standard Deviation (Sample) | 8.3% | 2.5% |
| Standard Deviation (Population) | 8.2% | 2.5% |
Similar Demographics by Male Unemployment
Demographics Similar to Blackfeet by Male Unemployment
In terms of male unemployment, the demographic groups most similar to Blackfeet are Immigrants from Uzbekistan (6.0%, a difference of 0.23%), Armenian (6.0%, a difference of 0.24%), Immigrants from Sierra Leone (6.0%, a difference of 0.41%), Subsaharan African (6.0%, a difference of 0.50%), and Menominee (6.0%, a difference of 0.57%).
| Demographics | Rating | Rank | Male Unemployment |
| Immigrants | Mexico | 0.0 /100 | #264 | Tragic 5.9% |
| French American Indians | 0.0 /100 | #265 | Tragic 5.9% |
| Bahamians | 0.0 /100 | #266 | Tragic 5.9% |
| Nigerians | 0.0 /100 | #267 | Tragic 5.9% |
| Bermudans | 0.0 /100 | #268 | Tragic 5.9% |
| Immigrants | Nigeria | 0.0 /100 | #269 | Tragic 6.0% |
| Sub-Saharan Africans | 0.0 /100 | #270 | Tragic 6.0% |
| Blackfeet | 0.0 /100 | #271 | Tragic 6.0% |
| Immigrants | Uzbekistan | 0.0 /100 | #272 | Tragic 6.0% |
| Armenians | 0.0 /100 | #273 | Tragic 6.0% |
| Immigrants | Sierra Leone | 0.0 /100 | #274 | Tragic 6.0% |
| Menominee | 0.0 /100 | #275 | Tragic 6.0% |
| Tlingit-Haida | 0.0 /100 | #276 | Tragic 6.0% |
| Immigrants | Liberia | 0.0 /100 | #277 | Tragic 6.1% |
| Immigrants | Fiji | 0.0 /100 | #278 | Tragic 6.1% |
Demographics Similar to Immigrants from Kuwait by Male Unemployment
In terms of male unemployment, the demographic groups most similar to Immigrants from Kuwait are Immigrants from Spain (5.1%, a difference of 0.040%), Uruguayan (5.1%, a difference of 0.070%), Russian (5.1%, a difference of 0.080%), Asian (5.1%, a difference of 0.11%), and German Russian (5.1%, a difference of 0.12%).
| Demographics | Rating | Rank | Male Unemployment |
| Immigrants | Turkey | 94.4 /100 | #91 | Exceptional 5.1% |
| Slavs | 94.2 /100 | #92 | Exceptional 5.1% |
| Immigrants | Serbia | 94.2 /100 | #93 | Exceptional 5.1% |
| Canadians | 94.1 /100 | #94 | Exceptional 5.1% |
| Italians | 93.8 /100 | #95 | Exceptional 5.1% |
| Asians | 93.7 /100 | #96 | Exceptional 5.1% |
| Immigrants | Spain | 93.4 /100 | #97 | Exceptional 5.1% |
| Immigrants | Kuwait | 93.3 /100 | #98 | Exceptional 5.1% |
| Uruguayans | 93.0 /100 | #99 | Exceptional 5.1% |
| Russians | 92.9 /100 | #100 | Exceptional 5.1% |
| German Russians | 92.7 /100 | #101 | Exceptional 5.1% |
| Immigrants | France | 92.7 /100 | #102 | Exceptional 5.1% |
| Immigrants | Jordan | 91.9 /100 | #103 | Exceptional 5.1% |
| Immigrants | Chile | 91.8 /100 | #104 | Exceptional 5.1% |
| Immigrants | Czechoslovakia | 91.7 /100 | #105 | Exceptional 5.1% |