Senegalese vs Immigrants from Brazil Male Unemployment
COMPARE
Senegalese
Immigrants from Brazil
Male Unemployment
Male Unemployment Comparison
Senegalese
Immigrants from Brazil
6.4%
MALE UNEMPLOYMENT
0.0/ 100
METRIC RATING
294th/ 347
METRIC RANK
5.2%
MALE UNEMPLOYMENT
86.3/ 100
METRIC RATING
127th/ 347
METRIC RANK
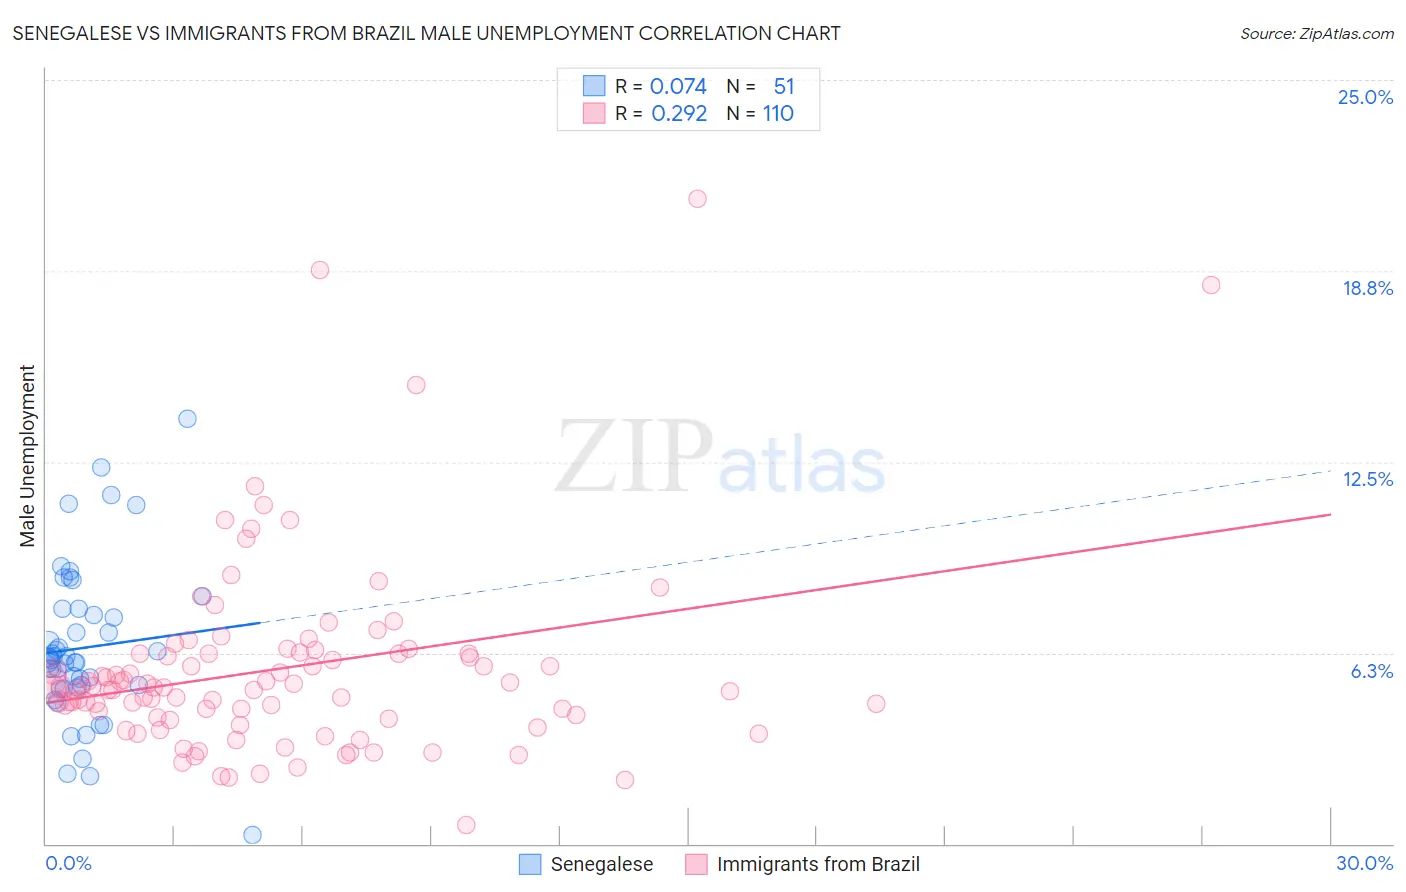
Senegalese vs Immigrants from Brazil Male Unemployment Correlation Chart
The statistical analysis conducted on geographies consisting of 78,095,938 people shows a slight positive correlation between the proportion of Senegalese and unemployment rate among males in the United States with a correlation coefficient (R) of 0.074 and weighted average of 6.4%. Similarly, the statistical analysis conducted on geographies consisting of 342,068,748 people shows a weak positive correlation between the proportion of Immigrants from Brazil and unemployment rate among males in the United States with a correlation coefficient (R) of 0.292 and weighted average of 5.2%, a difference of 25.1%.
Male Unemployment Correlation Summary
| Measurement | Senegalese | Immigrants from Brazil |
| Minimum | 0.30% | 0.60% |
| Maximum | 13.9% | 21.1% |
| Range | 13.6% | 20.5% |
| Mean | 6.4% | 5.7% |
| Median | 6.0% | 5.1% |
| Interquartile 25% (IQ1) | 5.1% | 4.1% |
| Interquartile 75% (IQ3) | 7.7% | 6.2% |
| Interquartile Range (IQR) | 2.6% | 2.1% |
| Standard Deviation (Sample) | 2.6% | 3.2% |
| Standard Deviation (Population) | 2.6% | 3.2% |
Similar Demographics by Male Unemployment
Demographics Similar to Senegalese by Male Unemployment
In terms of male unemployment, the demographic groups most similar to Senegalese are Haitian (6.4%, a difference of 0.11%), Nepalese (6.4%, a difference of 0.14%), Immigrants from the Azores (6.4%, a difference of 0.48%), Belizean (6.5%, a difference of 0.85%), and U.S. Virgin Islander (6.4%, a difference of 1.0%).
| Demographics | Rating | Rank | Male Unemployment |
| Central American Indians | 0.0 /100 | #287 | Tragic 6.3% |
| Immigrants | Senegal | 0.0 /100 | #288 | Tragic 6.3% |
| Immigrants | Caribbean | 0.0 /100 | #289 | Tragic 6.3% |
| U.S. Virgin Islanders | 0.0 /100 | #290 | Tragic 6.4% |
| Immigrants | Azores | 0.0 /100 | #291 | Tragic 6.4% |
| Nepalese | 0.0 /100 | #292 | Tragic 6.4% |
| Haitians | 0.0 /100 | #293 | Tragic 6.4% |
| Senegalese | 0.0 /100 | #294 | Tragic 6.4% |
| Belizeans | 0.0 /100 | #295 | Tragic 6.5% |
| Immigrants | Haiti | 0.0 /100 | #296 | Tragic 6.5% |
| Chippewa | 0.0 /100 | #297 | Tragic 6.6% |
| Jamaicans | 0.0 /100 | #298 | Tragic 6.6% |
| Immigrants | Bangladesh | 0.0 /100 | #299 | Tragic 6.6% |
| Vietnamese | 0.0 /100 | #300 | Tragic 6.6% |
| Immigrants | Belize | 0.0 /100 | #301 | Tragic 6.6% |
Demographics Similar to Immigrants from Brazil by Male Unemployment
In terms of male unemployment, the demographic groups most similar to Immigrants from Brazil are Immigrants from Colombia (5.1%, a difference of 0.060%), Immigrants from Lithuania (5.1%, a difference of 0.11%), Immigrants from Latvia (5.1%, a difference of 0.15%), Hungarian (5.2%, a difference of 0.15%), and Palestinian (5.1%, a difference of 0.18%).
| Demographics | Rating | Rank | Male Unemployment |
| Ukrainians | 88.4 /100 | #120 | Excellent 5.1% |
| Mongolians | 88.4 /100 | #121 | Excellent 5.1% |
| Nicaraguans | 88.2 /100 | #122 | Excellent 5.1% |
| Palestinians | 87.7 /100 | #123 | Excellent 5.1% |
| Immigrants | Latvia | 87.5 /100 | #124 | Excellent 5.1% |
| Immigrants | Lithuania | 87.2 /100 | #125 | Excellent 5.1% |
| Immigrants | Colombia | 86.8 /100 | #126 | Excellent 5.1% |
| Immigrants | Brazil | 86.3 /100 | #127 | Excellent 5.2% |
| Hungarians | 85.1 /100 | #128 | Excellent 5.2% |
| Immigrants | Western Europe | 84.8 /100 | #129 | Excellent 5.2% |
| Immigrants | Malaysia | 83.5 /100 | #130 | Excellent 5.2% |
| Immigrants | Germany | 83.0 /100 | #131 | Excellent 5.2% |
| Chickasaw | 82.9 /100 | #132 | Excellent 5.2% |
| Colombians | 81.1 /100 | #133 | Excellent 5.2% |
| Pakistanis | 80.5 /100 | #134 | Excellent 5.2% |