Scotch-Irish vs Black/African American Unemployment Among Ages 16 to 19 years
COMPARE
Scotch-Irish
Black/African American
Unemployment Among Ages 16 to 19 years
Unemployment Among Ages 16 to 19 years Comparison
Scotch-Irish
Blacks/African Americans
16.6%
UNEMPLOYMENT AMONG AGES 16 TO 19 YEARS
99.1/ 100
METRIC RATING
63rd/ 347
METRIC RANK
21.4%
UNEMPLOYMENT AMONG AGES 16 TO 19 YEARS
0.0/ 100
METRIC RATING
307th/ 347
METRIC RANK
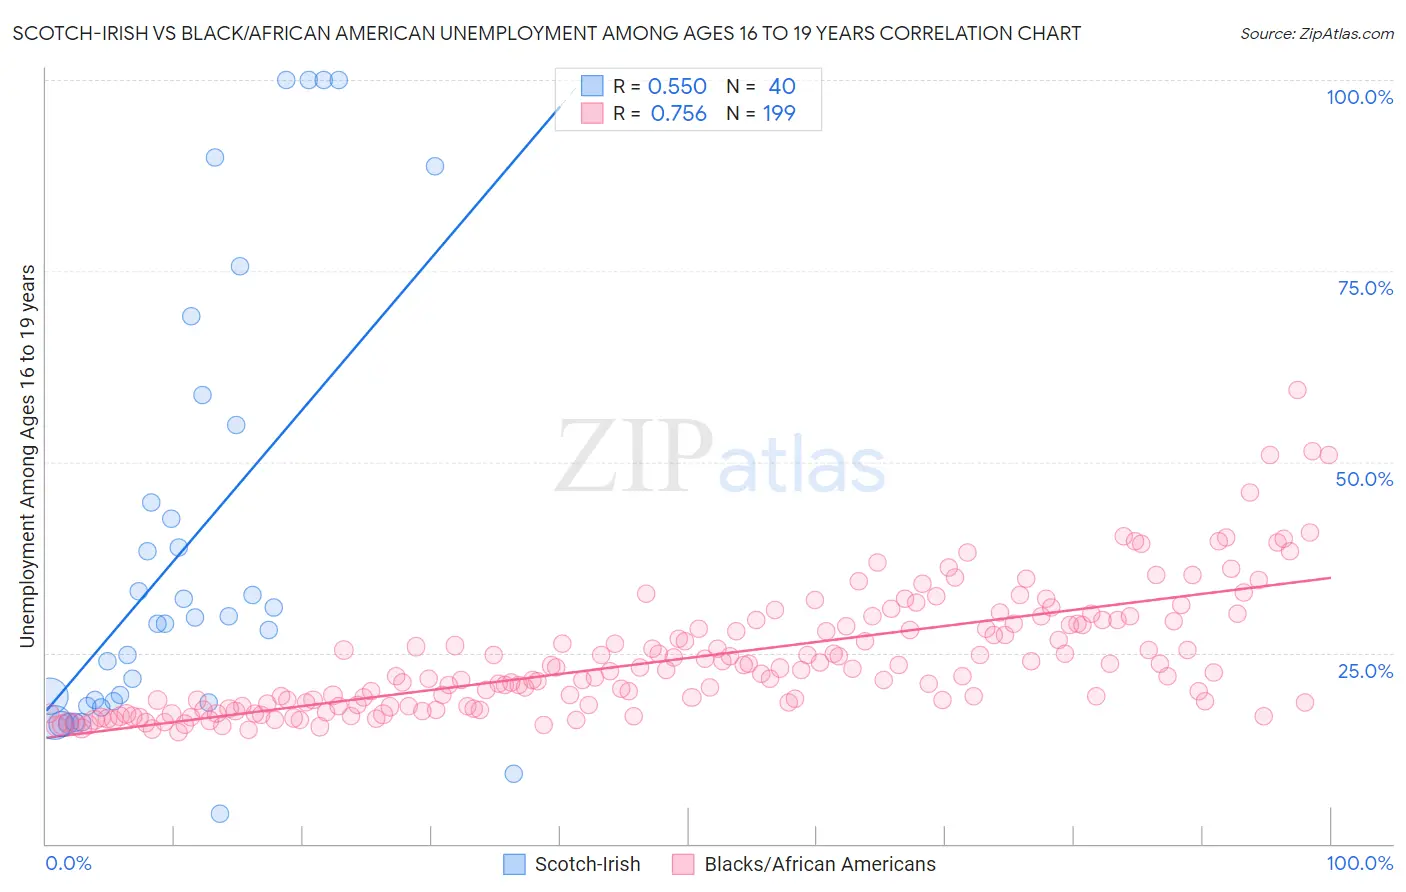
Scotch-Irish vs Black/African American Unemployment Among Ages 16 to 19 years Correlation Chart
The statistical analysis conducted on geographies consisting of 491,977,609 people shows a substantial positive correlation between the proportion of Scotch-Irish and unemployment rate among population between the ages 16 and 19 in the United States with a correlation coefficient (R) of 0.550 and weighted average of 16.6%. Similarly, the statistical analysis conducted on geographies consisting of 508,068,694 people shows a strong positive correlation between the proportion of Blacks/African Americans and unemployment rate among population between the ages 16 and 19 in the United States with a correlation coefficient (R) of 0.756 and weighted average of 21.4%, a difference of 28.8%.
Unemployment Among Ages 16 to 19 years Correlation Summary
| Measurement | Scotch-Irish | Black/African American |
| Minimum | 3.9% | 14.6% |
| Maximum | 100.0% | 59.4% |
| Range | 96.1% | 44.7% |
| Mean | 39.2% | 24.3% |
| Median | 29.2% | 22.4% |
| Interquartile 25% (IQ1) | 18.6% | 18.0% |
| Interquartile 75% (IQ3) | 49.8% | 28.6% |
| Interquartile Range (IQR) | 31.2% | 10.6% |
| Standard Deviation (Sample) | 28.6% | 8.0% |
| Standard Deviation (Population) | 28.3% | 8.0% |
Similar Demographics by Unemployment Among Ages 16 to 19 years
Demographics Similar to Scotch-Irish by Unemployment Among Ages 16 to 19 years
In terms of unemployment among ages 16 to 19 years, the demographic groups most similar to Scotch-Irish are Northern European (16.6%, a difference of 0.070%), Immigrants from Japan (16.6%, a difference of 0.16%), Macedonian (16.6%, a difference of 0.18%), Okinawan (16.6%, a difference of 0.20%), and Immigrants from Cuba (16.6%, a difference of 0.28%).
| Demographics | Rating | Rank | Unemployment Among Ages 16 to 19 years |
| Sri Lankans | 99.5 /100 | #56 | Exceptional 16.5% |
| Immigrants | Jordan | 99.4 /100 | #57 | Exceptional 16.5% |
| Immigrants | Uganda | 99.4 /100 | #58 | Exceptional 16.5% |
| Irish | 99.4 /100 | #59 | Exceptional 16.5% |
| Menominee | 99.3 /100 | #60 | Exceptional 16.6% |
| Immigrants | Cuba | 99.2 /100 | #61 | Exceptional 16.6% |
| Macedonians | 99.2 /100 | #62 | Exceptional 16.6% |
| Scotch-Irish | 99.1 /100 | #63 | Exceptional 16.6% |
| Northern Europeans | 99.0 /100 | #64 | Exceptional 16.6% |
| Immigrants | Japan | 98.9 /100 | #65 | Exceptional 16.6% |
| Okinawans | 98.9 /100 | #66 | Exceptional 16.6% |
| Slavs | 98.7 /100 | #67 | Exceptional 16.7% |
| Chickasaw | 98.7 /100 | #68 | Exceptional 16.7% |
| Serbians | 98.7 /100 | #69 | Exceptional 16.7% |
| Austrians | 98.6 /100 | #70 | Exceptional 16.7% |
Demographics Similar to Blacks/African Americans by Unemployment Among Ages 16 to 19 years
In terms of unemployment among ages 16 to 19 years, the demographic groups most similar to Blacks/African Americans are Immigrants from Bangladesh (21.5%, a difference of 0.38%), Native/Alaskan (21.5%, a difference of 0.54%), U.S. Virgin Islander (21.3%, a difference of 0.58%), Vietnamese (21.5%, a difference of 0.60%), and Belizean (21.6%, a difference of 0.82%).
| Demographics | Rating | Rank | Unemployment Among Ages 16 to 19 years |
| Ecuadorians | 0.0 /100 | #300 | Tragic 20.5% |
| Immigrants | Ecuador | 0.0 /100 | #301 | Tragic 20.9% |
| Immigrants | Caribbean | 0.0 /100 | #302 | Tragic 20.9% |
| Senegalese | 0.0 /100 | #303 | Tragic 21.0% |
| Aleuts | 0.0 /100 | #304 | Tragic 21.2% |
| Immigrants | Senegal | 0.0 /100 | #305 | Tragic 21.2% |
| U.S. Virgin Islanders | 0.0 /100 | #306 | Tragic 21.3% |
| Blacks/African Americans | 0.0 /100 | #307 | Tragic 21.4% |
| Immigrants | Bangladesh | 0.0 /100 | #308 | Tragic 21.5% |
| Natives/Alaskans | 0.0 /100 | #309 | Tragic 21.5% |
| Vietnamese | 0.0 /100 | #310 | Tragic 21.5% |
| Belizeans | 0.0 /100 | #311 | Tragic 21.6% |
| Houma | 0.0 /100 | #312 | Tragic 21.6% |
| Jamaicans | 0.0 /100 | #313 | Tragic 21.7% |
| Alaska Natives | 0.0 /100 | #314 | Tragic 21.8% |