Irish vs Black/African American Unemployment Among Ages 16 to 19 years
COMPARE
Irish
Black/African American
Unemployment Among Ages 16 to 19 years
Unemployment Among Ages 16 to 19 years Comparison
Irish
Blacks/African Americans
16.5%
UNEMPLOYMENT AMONG AGES 16 TO 19 YEARS
99.4/ 100
METRIC RATING
59th/ 347
METRIC RANK
21.4%
UNEMPLOYMENT AMONG AGES 16 TO 19 YEARS
0.0/ 100
METRIC RATING
307th/ 347
METRIC RANK
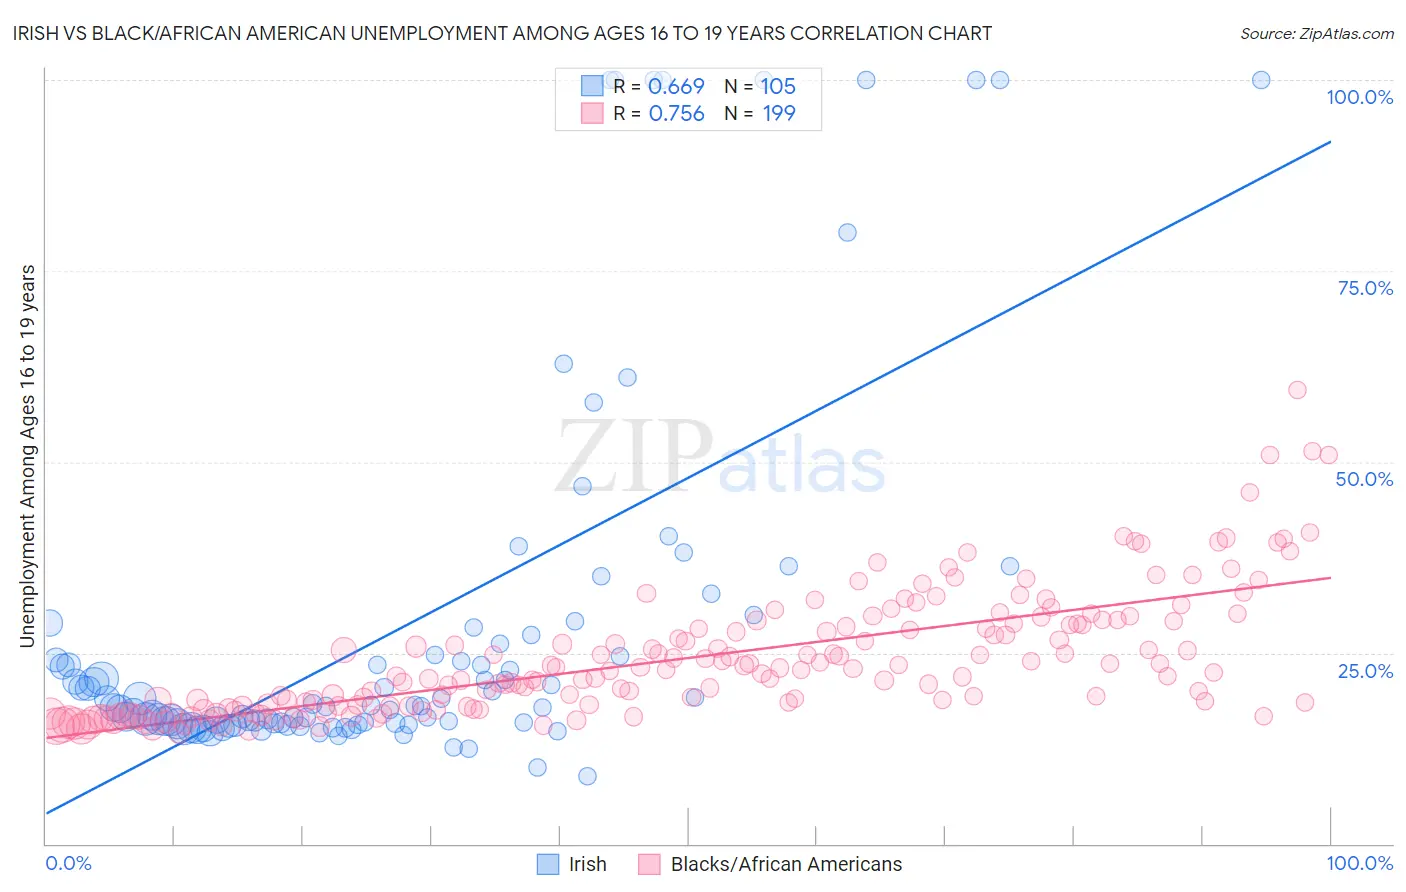
Irish vs Black/African American Unemployment Among Ages 16 to 19 years Correlation Chart
The statistical analysis conducted on geographies consisting of 512,143,285 people shows a significant positive correlation between the proportion of Irish and unemployment rate among population between the ages 16 and 19 in the United States with a correlation coefficient (R) of 0.669 and weighted average of 16.5%. Similarly, the statistical analysis conducted on geographies consisting of 508,068,694 people shows a strong positive correlation between the proportion of Blacks/African Americans and unemployment rate among population between the ages 16 and 19 in the United States with a correlation coefficient (R) of 0.756 and weighted average of 21.4%, a difference of 29.5%.
Unemployment Among Ages 16 to 19 years Correlation Summary
| Measurement | Irish | Black/African American |
| Minimum | 8.8% | 14.6% |
| Maximum | 100.0% | 59.4% |
| Range | 91.2% | 44.7% |
| Mean | 28.6% | 24.3% |
| Median | 18.1% | 22.4% |
| Interquartile 25% (IQ1) | 15.8% | 18.0% |
| Interquartile 75% (IQ3) | 26.8% | 28.6% |
| Interquartile Range (IQR) | 11.0% | 10.6% |
| Standard Deviation (Sample) | 24.6% | 8.0% |
| Standard Deviation (Population) | 24.5% | 8.0% |
Similar Demographics by Unemployment Among Ages 16 to 19 years
Demographics Similar to Irish by Unemployment Among Ages 16 to 19 years
In terms of unemployment among ages 16 to 19 years, the demographic groups most similar to Irish are Immigrants from Uganda (16.5%, a difference of 0.050%), Immigrants from Jordan (16.5%, a difference of 0.10%), Menominee (16.6%, a difference of 0.17%), Immigrants from Cuba (16.6%, a difference of 0.23%), and Macedonian (16.6%, a difference of 0.33%).
| Demographics | Rating | Rank | Unemployment Among Ages 16 to 19 years |
| Welsh | 99.6 /100 | #52 | Exceptional 16.4% |
| Slovenes | 99.6 /100 | #53 | Exceptional 16.4% |
| British | 99.5 /100 | #54 | Exceptional 16.5% |
| Czechoslovakians | 99.5 /100 | #55 | Exceptional 16.5% |
| Sri Lankans | 99.5 /100 | #56 | Exceptional 16.5% |
| Immigrants | Jordan | 99.4 /100 | #57 | Exceptional 16.5% |
| Immigrants | Uganda | 99.4 /100 | #58 | Exceptional 16.5% |
| Irish | 99.4 /100 | #59 | Exceptional 16.5% |
| Menominee | 99.3 /100 | #60 | Exceptional 16.6% |
| Immigrants | Cuba | 99.2 /100 | #61 | Exceptional 16.6% |
| Macedonians | 99.2 /100 | #62 | Exceptional 16.6% |
| Scotch-Irish | 99.1 /100 | #63 | Exceptional 16.6% |
| Northern Europeans | 99.0 /100 | #64 | Exceptional 16.6% |
| Immigrants | Japan | 98.9 /100 | #65 | Exceptional 16.6% |
| Okinawans | 98.9 /100 | #66 | Exceptional 16.6% |
Demographics Similar to Blacks/African Americans by Unemployment Among Ages 16 to 19 years
In terms of unemployment among ages 16 to 19 years, the demographic groups most similar to Blacks/African Americans are Immigrants from Bangladesh (21.5%, a difference of 0.38%), Native/Alaskan (21.5%, a difference of 0.54%), U.S. Virgin Islander (21.3%, a difference of 0.58%), Vietnamese (21.5%, a difference of 0.60%), and Belizean (21.6%, a difference of 0.82%).
| Demographics | Rating | Rank | Unemployment Among Ages 16 to 19 years |
| Ecuadorians | 0.0 /100 | #300 | Tragic 20.5% |
| Immigrants | Ecuador | 0.0 /100 | #301 | Tragic 20.9% |
| Immigrants | Caribbean | 0.0 /100 | #302 | Tragic 20.9% |
| Senegalese | 0.0 /100 | #303 | Tragic 21.0% |
| Aleuts | 0.0 /100 | #304 | Tragic 21.2% |
| Immigrants | Senegal | 0.0 /100 | #305 | Tragic 21.2% |
| U.S. Virgin Islanders | 0.0 /100 | #306 | Tragic 21.3% |
| Blacks/African Americans | 0.0 /100 | #307 | Tragic 21.4% |
| Immigrants | Bangladesh | 0.0 /100 | #308 | Tragic 21.5% |
| Natives/Alaskans | 0.0 /100 | #309 | Tragic 21.5% |
| Vietnamese | 0.0 /100 | #310 | Tragic 21.5% |
| Belizeans | 0.0 /100 | #311 | Tragic 21.6% |
| Houma | 0.0 /100 | #312 | Tragic 21.6% |
| Jamaicans | 0.0 /100 | #313 | Tragic 21.7% |
| Alaska Natives | 0.0 /100 | #314 | Tragic 21.8% |