Immigrants from Trinidad and Tobago vs Black/African American Unemployment Among Ages 16 to 19 years
COMPARE
Immigrants from Trinidad and Tobago
Black/African American
Unemployment Among Ages 16 to 19 years
Unemployment Among Ages 16 to 19 years Comparison
Immigrants from Trinidad and Tobago
Blacks/African Americans
23.1%
UNEMPLOYMENT AMONG AGES 16 TO 19 YEARS
0.0/ 100
METRIC RATING
326th/ 347
METRIC RANK
21.4%
UNEMPLOYMENT AMONG AGES 16 TO 19 YEARS
0.0/ 100
METRIC RATING
307th/ 347
METRIC RANK
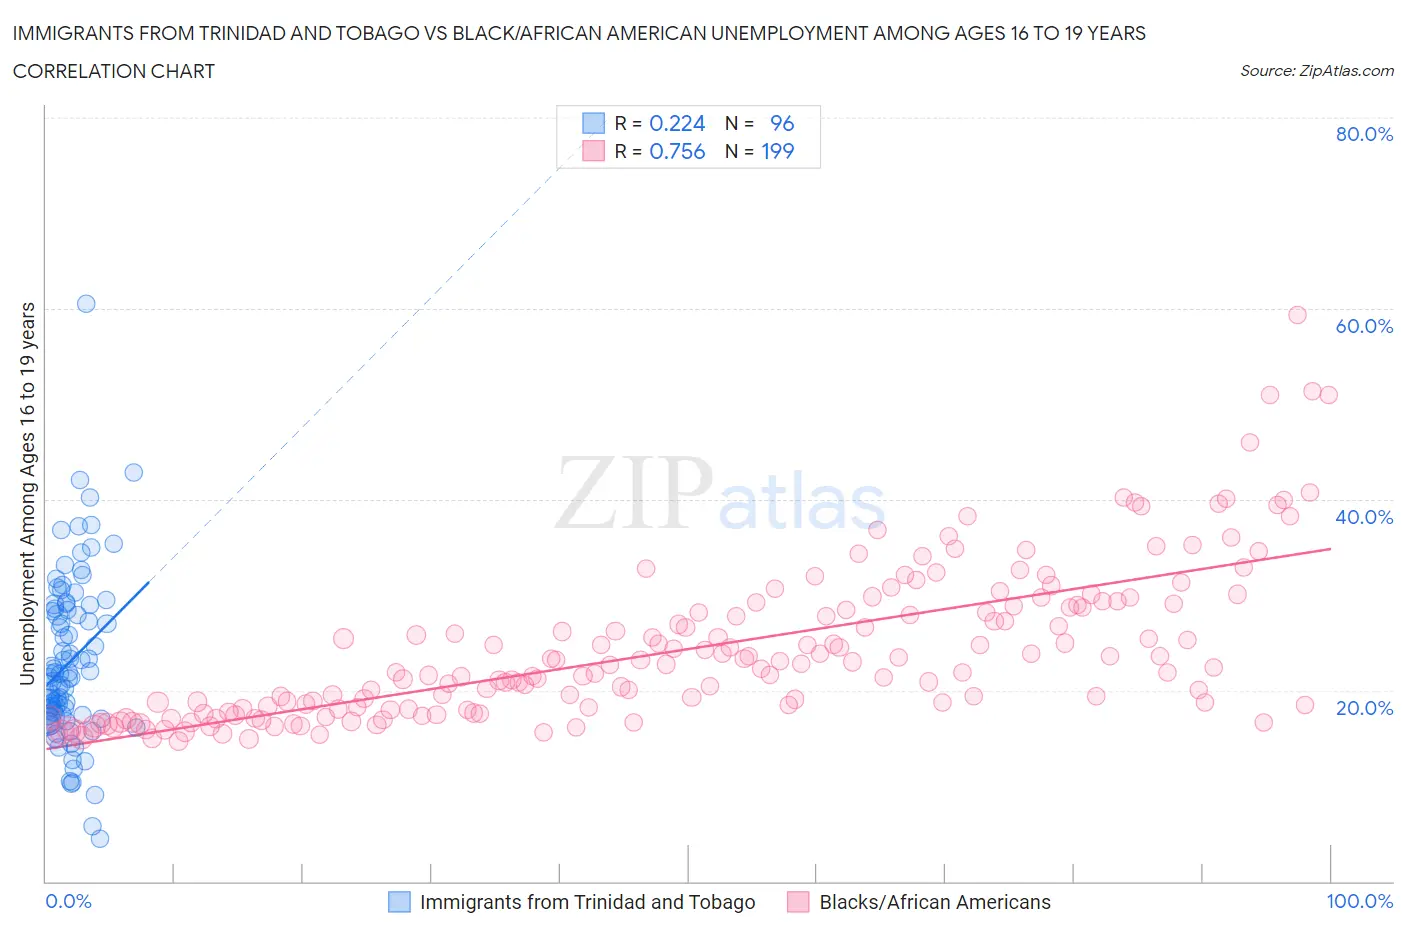
Immigrants from Trinidad and Tobago vs Black/African American Unemployment Among Ages 16 to 19 years Correlation Chart
The statistical analysis conducted on geographies consisting of 216,632,752 people shows a weak positive correlation between the proportion of Immigrants from Trinidad and Tobago and unemployment rate among population between the ages 16 and 19 in the United States with a correlation coefficient (R) of 0.224 and weighted average of 23.1%. Similarly, the statistical analysis conducted on geographies consisting of 508,068,694 people shows a strong positive correlation between the proportion of Blacks/African Americans and unemployment rate among population between the ages 16 and 19 in the United States with a correlation coefficient (R) of 0.756 and weighted average of 21.4%, a difference of 7.9%.
Unemployment Among Ages 16 to 19 years Correlation Summary
| Measurement | Immigrants from Trinidad and Tobago | Black/African American |
| Minimum | 4.5% | 14.6% |
| Maximum | 60.5% | 59.4% |
| Range | 56.0% | 44.7% |
| Mean | 23.0% | 24.3% |
| Median | 21.5% | 22.4% |
| Interquartile 25% (IQ1) | 17.4% | 18.0% |
| Interquartile 75% (IQ3) | 28.5% | 28.6% |
| Interquartile Range (IQR) | 11.1% | 10.6% |
| Standard Deviation (Sample) | 8.8% | 8.0% |
| Standard Deviation (Population) | 8.7% | 8.0% |
Demographics Similar to Immigrants from Trinidad and Tobago and Blacks/African Americans by Unemployment Among Ages 16 to 19 years
In terms of unemployment among ages 16 to 19 years, the demographic groups most similar to Immigrants from Trinidad and Tobago are Trinidadian and Tobagonian (22.6%, a difference of 2.0%), Immigrants from Armenia (22.6%, a difference of 2.1%), Yakama (22.5%, a difference of 2.6%), Barbadian (22.5%, a difference of 2.8%), and West Indian (22.4%, a difference of 2.9%). Similarly, the demographic groups most similar to Blacks/African Americans are Immigrants from Bangladesh (21.5%, a difference of 0.38%), Native/Alaskan (21.5%, a difference of 0.54%), U.S. Virgin Islander (21.3%, a difference of 0.58%), Vietnamese (21.5%, a difference of 0.60%), and Belizean (21.6%, a difference of 0.82%).
| Demographics | Rating | Rank | Unemployment Among Ages 16 to 19 years |
| U.S. Virgin Islanders | 0.0 /100 | #306 | Tragic 21.3% |
| Blacks/African Americans | 0.0 /100 | #307 | Tragic 21.4% |
| Immigrants | Bangladesh | 0.0 /100 | #308 | Tragic 21.5% |
| Natives/Alaskans | 0.0 /100 | #309 | Tragic 21.5% |
| Vietnamese | 0.0 /100 | #310 | Tragic 21.5% |
| Belizeans | 0.0 /100 | #311 | Tragic 21.6% |
| Houma | 0.0 /100 | #312 | Tragic 21.6% |
| Jamaicans | 0.0 /100 | #313 | Tragic 21.7% |
| Alaska Natives | 0.0 /100 | #314 | Tragic 21.8% |
| Immigrants | Dominica | 0.0 /100 | #315 | Tragic 21.9% |
| Tohono O'odham | 0.0 /100 | #316 | Tragic 22.1% |
| Immigrants | Belize | 0.0 /100 | #317 | Tragic 22.2% |
| Immigrants | Jamaica | 0.0 /100 | #318 | Tragic 22.2% |
| Immigrants | West Indies | 0.0 /100 | #319 | Tragic 22.2% |
| Cheyenne | 0.0 /100 | #320 | Tragic 22.3% |
| West Indians | 0.0 /100 | #321 | Tragic 22.4% |
| Barbadians | 0.0 /100 | #322 | Tragic 22.5% |
| Yakama | 0.0 /100 | #323 | Tragic 22.5% |
| Immigrants | Armenia | 0.0 /100 | #324 | Tragic 22.6% |
| Trinidadians and Tobagonians | 0.0 /100 | #325 | Tragic 22.6% |
| Immigrants | Trinidad and Tobago | 0.0 /100 | #326 | Tragic 23.1% |