Immigrants from Middle Africa vs West Indian Male Unemployment
COMPARE
Immigrants from Middle Africa
West Indian
Male Unemployment
Male Unemployment Comparison
Immigrants from Middle Africa
West Indians
5.5%
MALE UNEMPLOYMENT
8.3/ 100
METRIC RATING
209th/ 347
METRIC RANK
6.7%
MALE UNEMPLOYMENT
0.0/ 100
METRIC RATING
304th/ 347
METRIC RANK
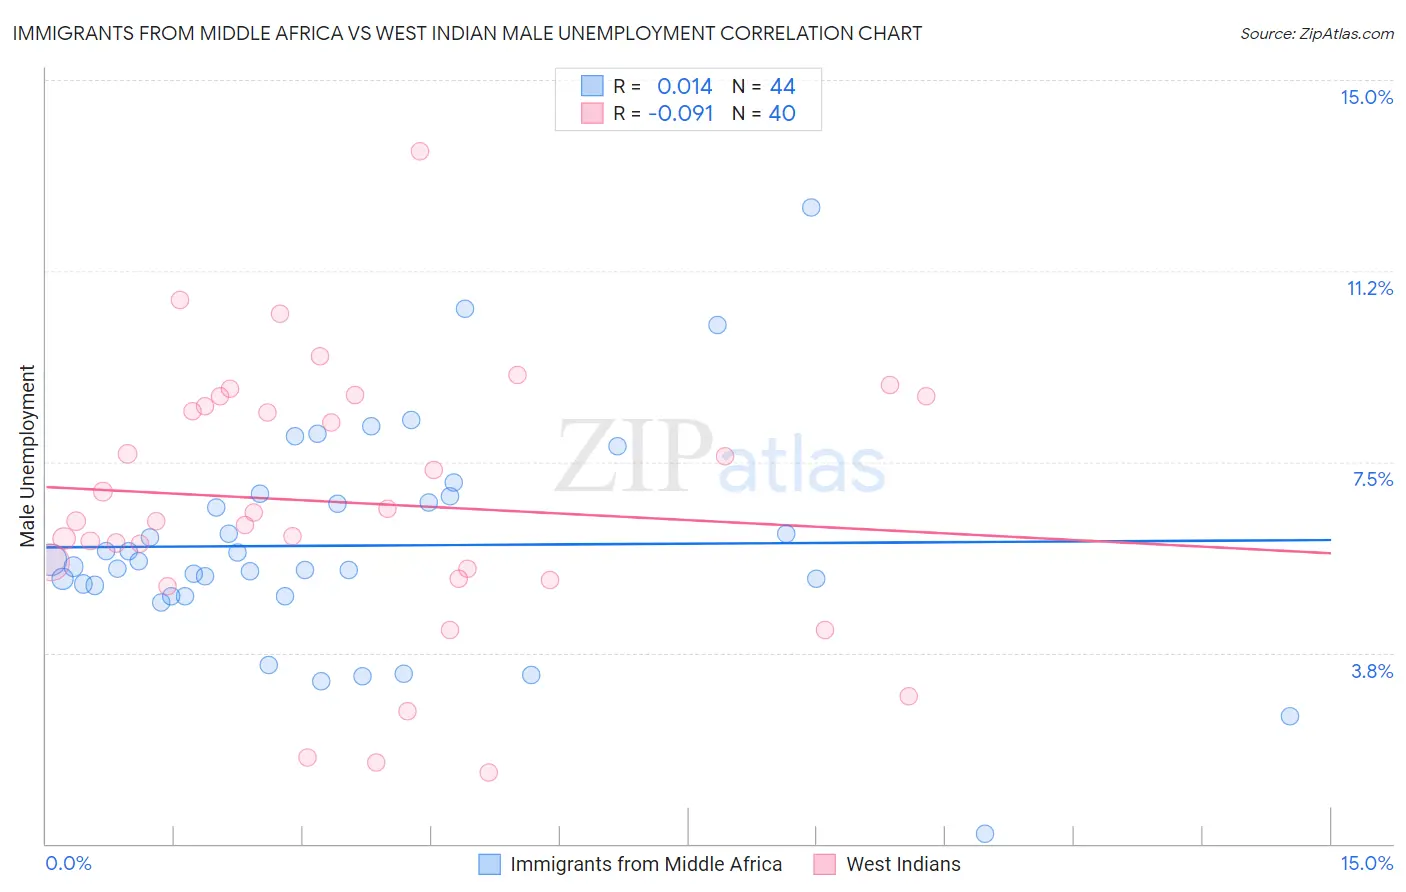
Immigrants from Middle Africa vs West Indian Male Unemployment Correlation Chart
The statistical analysis conducted on geographies consisting of 202,406,259 people shows no correlation between the proportion of Immigrants from Middle Africa and unemployment rate among males in the United States with a correlation coefficient (R) of 0.014 and weighted average of 5.5%. Similarly, the statistical analysis conducted on geographies consisting of 253,602,585 people shows a slight negative correlation between the proportion of West Indians and unemployment rate among males in the United States with a correlation coefficient (R) of -0.091 and weighted average of 6.7%, a difference of 21.5%.
Male Unemployment Correlation Summary
| Measurement | Immigrants from Middle Africa | West Indian |
| Minimum | 0.20% | 1.4% |
| Maximum | 12.5% | 13.6% |
| Range | 12.3% | 12.2% |
| Mean | 5.9% | 6.7% |
| Median | 5.5% | 6.4% |
| Interquartile 25% (IQ1) | 5.0% | 5.3% |
| Interquartile 75% (IQ3) | 6.8% | 8.7% |
| Interquartile Range (IQR) | 1.8% | 3.4% |
| Standard Deviation (Sample) | 2.1% | 2.6% |
| Standard Deviation (Population) | 2.1% | 2.6% |
Similar Demographics by Male Unemployment
Demographics Similar to Immigrants from Middle Africa by Male Unemployment
In terms of male unemployment, the demographic groups most similar to Immigrants from Middle Africa are Immigrants from Lebanon (5.5%, a difference of 0.050%), South American Indian (5.5%, a difference of 0.13%), Israeli (5.5%, a difference of 0.17%), Immigrants from Syria (5.5%, a difference of 0.18%), and Hmong (5.5%, a difference of 0.27%).
| Demographics | Rating | Rank | Male Unemployment |
| Immigrants | Nonimmigrants | 13.1 /100 | #202 | Poor 5.4% |
| Immigrants | Laos | 13.0 /100 | #203 | Poor 5.4% |
| Guamanians/Chamorros | 12.3 /100 | #204 | Poor 5.4% |
| Immigrants | Costa Rica | 11.4 /100 | #205 | Poor 5.5% |
| Immigrants | Ukraine | 9.9 /100 | #206 | Tragic 5.5% |
| Immigrants | Syria | 9.3 /100 | #207 | Tragic 5.5% |
| Immigrants | Lebanon | 8.6 /100 | #208 | Tragic 5.5% |
| Immigrants | Middle Africa | 8.3 /100 | #209 | Tragic 5.5% |
| South American Indians | 7.6 /100 | #210 | Tragic 5.5% |
| Israelis | 7.4 /100 | #211 | Tragic 5.5% |
| Hmong | 7.0 /100 | #212 | Tragic 5.5% |
| Ugandans | 6.3 /100 | #213 | Tragic 5.5% |
| Puget Sound Salish | 5.6 /100 | #214 | Tragic 5.5% |
| Samoans | 4.9 /100 | #215 | Tragic 5.5% |
| Immigrants | Immigrants | 4.3 /100 | #216 | Tragic 5.5% |
Demographics Similar to West Indians by Male Unemployment
In terms of male unemployment, the demographic groups most similar to West Indians are Immigrants from West Indies (6.7%, a difference of 0.0%), Trinidadian and Tobagonian (6.7%, a difference of 0.32%), Ute (6.6%, a difference of 0.37%), Immigrants from Trinidad and Tobago (6.7%, a difference of 0.52%), and Immigrants from Jamaica (6.7%, a difference of 0.60%).
| Demographics | Rating | Rank | Male Unemployment |
| Chippewa | 0.0 /100 | #297 | Tragic 6.6% |
| Jamaicans | 0.0 /100 | #298 | Tragic 6.6% |
| Immigrants | Bangladesh | 0.0 /100 | #299 | Tragic 6.6% |
| Vietnamese | 0.0 /100 | #300 | Tragic 6.6% |
| Immigrants | Belize | 0.0 /100 | #301 | Tragic 6.6% |
| Ute | 0.0 /100 | #302 | Tragic 6.6% |
| Immigrants | West Indies | 0.0 /100 | #303 | Tragic 6.7% |
| West Indians | 0.0 /100 | #304 | Tragic 6.7% |
| Trinidadians and Tobagonians | 0.0 /100 | #305 | Tragic 6.7% |
| Immigrants | Trinidad and Tobago | 0.0 /100 | #306 | Tragic 6.7% |
| Immigrants | Jamaica | 0.0 /100 | #307 | Tragic 6.7% |
| Aleuts | 0.0 /100 | #308 | Tragic 6.8% |
| Barbadians | 0.0 /100 | #309 | Tragic 6.9% |
| Blacks/African Americans | 0.0 /100 | #310 | Tragic 6.9% |
| Immigrants | Armenia | 0.0 /100 | #311 | Tragic 6.9% |