Immigrants from South Eastern Asia vs West Indian Male Unemployment
COMPARE
Immigrants from South Eastern Asia
West Indian
Male Unemployment
Male Unemployment Comparison
Immigrants from South Eastern Asia
West Indians
5.4%
MALE UNEMPLOYMENT
28.2/ 100
METRIC RATING
191st/ 347
METRIC RANK
6.7%
MALE UNEMPLOYMENT
0.0/ 100
METRIC RATING
304th/ 347
METRIC RANK
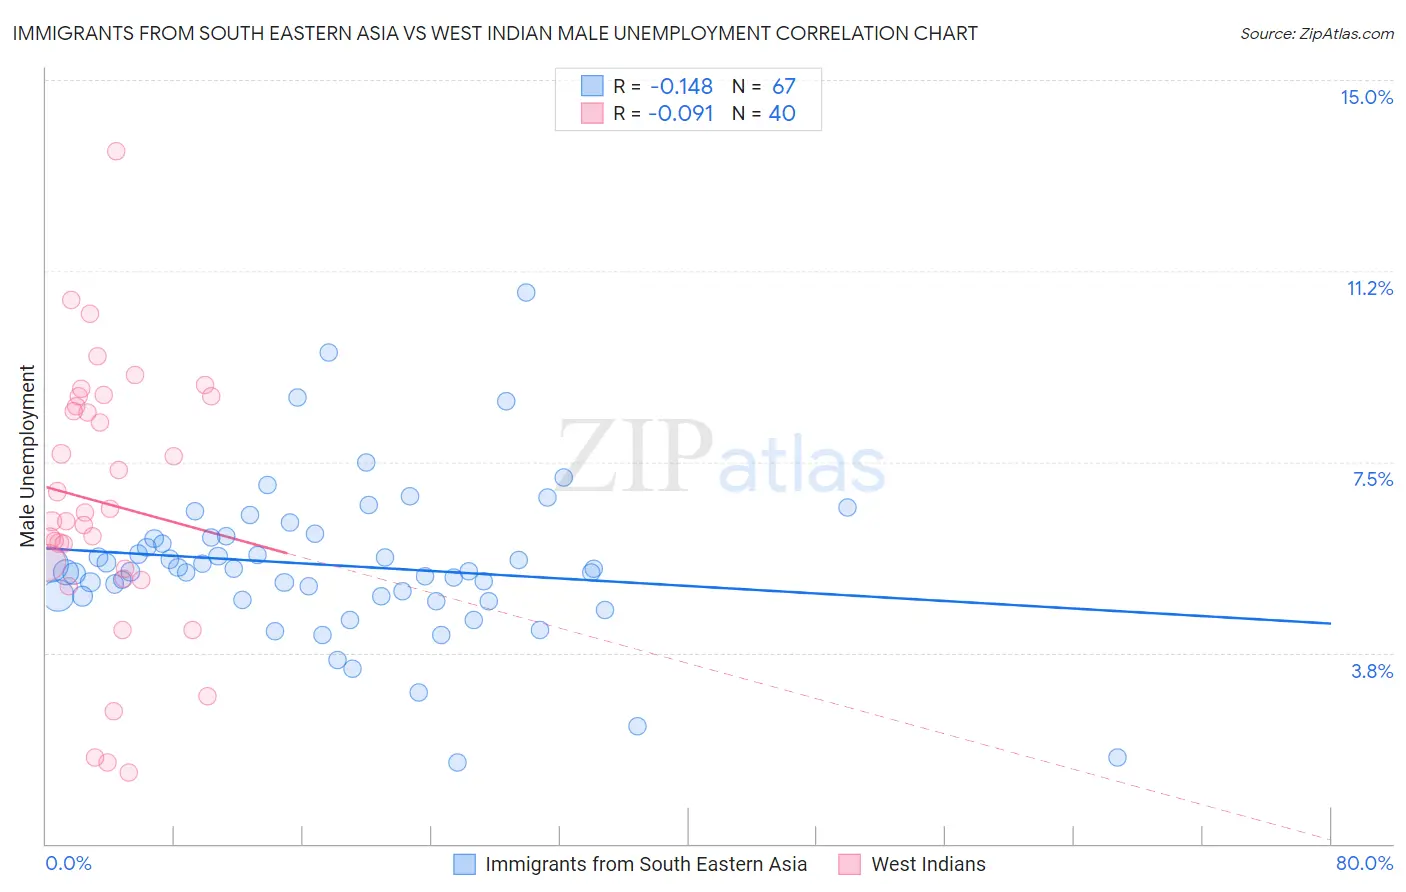
Immigrants from South Eastern Asia vs West Indian Male Unemployment Correlation Chart
The statistical analysis conducted on geographies consisting of 508,417,377 people shows a poor negative correlation between the proportion of Immigrants from South Eastern Asia and unemployment rate among males in the United States with a correlation coefficient (R) of -0.148 and weighted average of 5.4%. Similarly, the statistical analysis conducted on geographies consisting of 253,602,585 people shows a slight negative correlation between the proportion of West Indians and unemployment rate among males in the United States with a correlation coefficient (R) of -0.091 and weighted average of 6.7%, a difference of 24.1%.
Male Unemployment Correlation Summary
| Measurement | Immigrants from South Eastern Asia | West Indian |
| Minimum | 1.6% | 1.4% |
| Maximum | 10.8% | 13.6% |
| Range | 9.2% | 12.2% |
| Mean | 5.5% | 6.7% |
| Median | 5.3% | 6.4% |
| Interquartile 25% (IQ1) | 4.9% | 5.3% |
| Interquartile 75% (IQ3) | 6.0% | 8.7% |
| Interquartile Range (IQR) | 1.2% | 3.4% |
| Standard Deviation (Sample) | 1.5% | 2.6% |
| Standard Deviation (Population) | 1.5% | 2.6% |
Similar Demographics by Male Unemployment
Demographics Similar to Immigrants from South Eastern Asia by Male Unemployment
In terms of male unemployment, the demographic groups most similar to Immigrants from South Eastern Asia are Immigrants from Uganda (5.4%, a difference of 0.040%), Immigrants from South America (5.4%, a difference of 0.080%), Arab (5.4%, a difference of 0.14%), Immigrants from Belarus (5.4%, a difference of 0.16%), and Costa Rican (5.4%, a difference of 0.21%).
| Demographics | Rating | Rank | Male Unemployment |
| Spaniards | 35.1 /100 | #184 | Fair 5.3% |
| Koreans | 34.9 /100 | #185 | Fair 5.3% |
| Iraqis | 31.6 /100 | #186 | Fair 5.4% |
| Costa Ricans | 31.3 /100 | #187 | Fair 5.4% |
| Arabs | 30.2 /100 | #188 | Fair 5.4% |
| Immigrants | South America | 29.4 /100 | #189 | Fair 5.4% |
| Immigrants | Uganda | 28.8 /100 | #190 | Fair 5.4% |
| Immigrants | South Eastern Asia | 28.2 /100 | #191 | Fair 5.4% |
| Immigrants | Belarus | 26.0 /100 | #192 | Fair 5.4% |
| Immigrants | Israel | 25.2 /100 | #193 | Fair 5.4% |
| Spanish | 19.7 /100 | #194 | Poor 5.4% |
| Immigrants | Southern Europe | 17.7 /100 | #195 | Poor 5.4% |
| Albanians | 17.3 /100 | #196 | Poor 5.4% |
| Alsatians | 16.7 /100 | #197 | Poor 5.4% |
| Immigrants | Thailand | 14.7 /100 | #198 | Poor 5.4% |
Demographics Similar to West Indians by Male Unemployment
In terms of male unemployment, the demographic groups most similar to West Indians are Immigrants from West Indies (6.7%, a difference of 0.0%), Trinidadian and Tobagonian (6.7%, a difference of 0.32%), Ute (6.6%, a difference of 0.37%), Immigrants from Trinidad and Tobago (6.7%, a difference of 0.52%), and Immigrants from Jamaica (6.7%, a difference of 0.60%).
| Demographics | Rating | Rank | Male Unemployment |
| Chippewa | 0.0 /100 | #297 | Tragic 6.6% |
| Jamaicans | 0.0 /100 | #298 | Tragic 6.6% |
| Immigrants | Bangladesh | 0.0 /100 | #299 | Tragic 6.6% |
| Vietnamese | 0.0 /100 | #300 | Tragic 6.6% |
| Immigrants | Belize | 0.0 /100 | #301 | Tragic 6.6% |
| Ute | 0.0 /100 | #302 | Tragic 6.6% |
| Immigrants | West Indies | 0.0 /100 | #303 | Tragic 6.7% |
| West Indians | 0.0 /100 | #304 | Tragic 6.7% |
| Trinidadians and Tobagonians | 0.0 /100 | #305 | Tragic 6.7% |
| Immigrants | Trinidad and Tobago | 0.0 /100 | #306 | Tragic 6.7% |
| Immigrants | Jamaica | 0.0 /100 | #307 | Tragic 6.7% |
| Aleuts | 0.0 /100 | #308 | Tragic 6.8% |
| Barbadians | 0.0 /100 | #309 | Tragic 6.9% |
| Blacks/African Americans | 0.0 /100 | #310 | Tragic 6.9% |
| Immigrants | Armenia | 0.0 /100 | #311 | Tragic 6.9% |