Liberian vs Australian Doctorate Degree
COMPARE
Liberian
Australian
Doctorate Degree
Doctorate Degree Comparison
Liberians
Australians
1.5%
DOCTORATE DEGREE
0.9/ 100
METRIC RATING
259th/ 347
METRIC RANK
2.4%
DOCTORATE DEGREE
100.0/ 100
METRIC RATING
51st/ 347
METRIC RANK
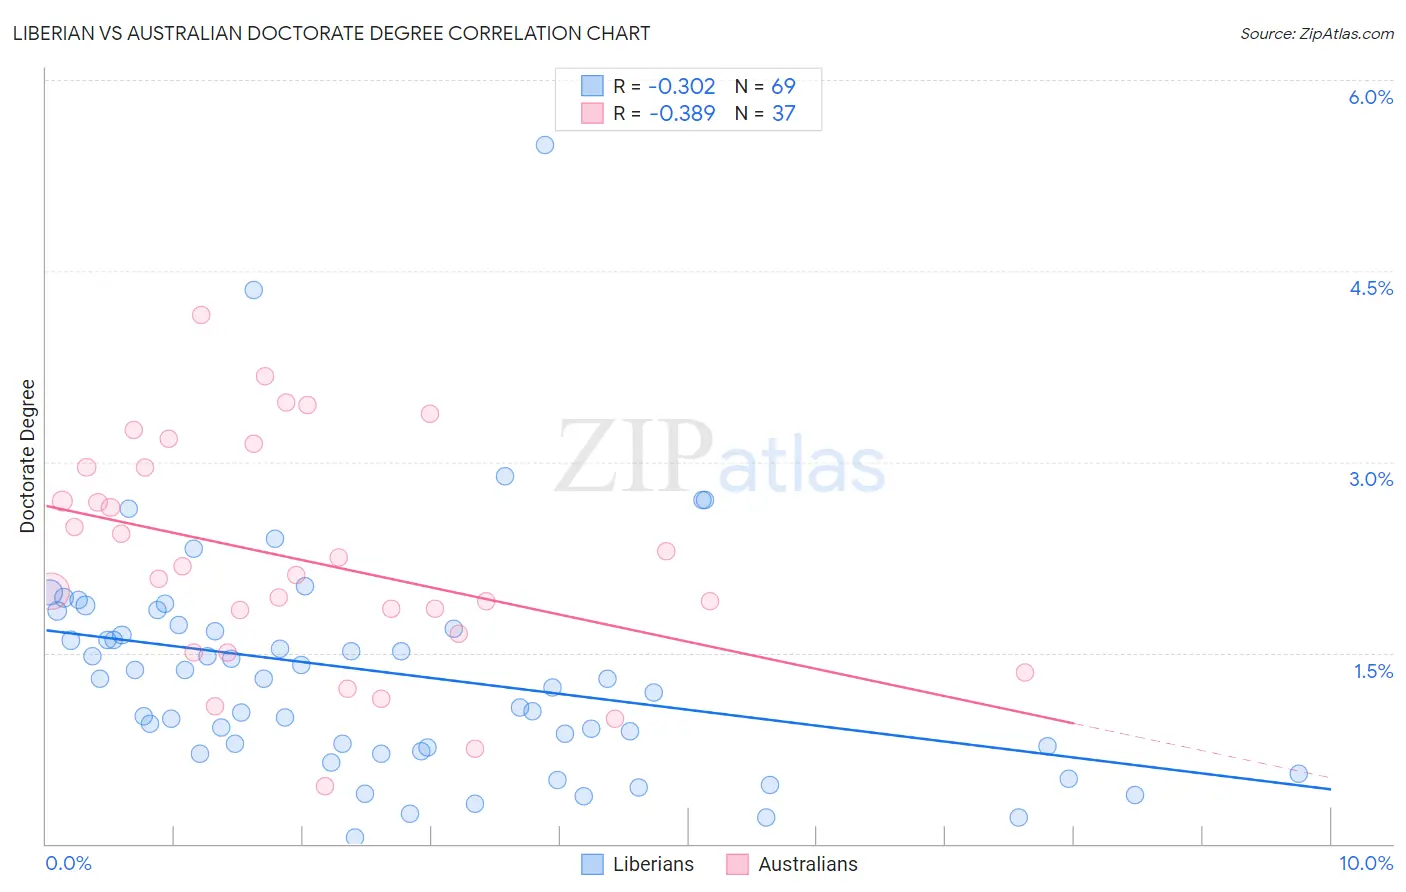
Liberian vs Australian Doctorate Degree Correlation Chart
The statistical analysis conducted on geographies consisting of 117,723,889 people shows a mild negative correlation between the proportion of Liberians and percentage of population with at least doctorate degree education in the United States with a correlation coefficient (R) of -0.302 and weighted average of 1.5%. Similarly, the statistical analysis conducted on geographies consisting of 223,128,872 people shows a mild negative correlation between the proportion of Australians and percentage of population with at least doctorate degree education in the United States with a correlation coefficient (R) of -0.389 and weighted average of 2.4%, a difference of 57.7%.
Doctorate Degree Correlation Summary
| Measurement | Liberian | Australian |
| Minimum | 0.049% | 0.45% |
| Maximum | 5.5% | 4.2% |
| Range | 5.4% | 3.7% |
| Mean | 1.3% | 2.2% |
| Median | 1.3% | 2.1% |
| Interquartile 25% (IQ1) | 0.74% | 1.6% |
| Interquartile 75% (IQ3) | 1.7% | 3.0% |
| Interquartile Range (IQR) | 0.96% | 1.4% |
| Standard Deviation (Sample) | 0.92% | 0.88% |
| Standard Deviation (Population) | 0.91% | 0.87% |
Similar Demographics by Doctorate Degree
Demographics Similar to Liberians by Doctorate Degree
In terms of doctorate degree, the demographic groups most similar to Liberians are Immigrants from West Indies (1.5%, a difference of 0.030%), Japanese (1.5%, a difference of 0.10%), Chippewa (1.5%, a difference of 0.28%), Central American Indian (1.5%, a difference of 0.51%), and Trinidadian and Tobagonian (1.5%, a difference of 0.55%).
| Demographics | Rating | Rank | Doctorate Degree |
| Yuman | 1.1 /100 | #252 | Tragic 1.5% |
| Americans | 1.0 /100 | #253 | Tragic 1.5% |
| Immigrants | Cambodia | 1.0 /100 | #254 | Tragic 1.5% |
| Trinidadians and Tobagonians | 1.0 /100 | #255 | Tragic 1.5% |
| Central American Indians | 1.0 /100 | #256 | Tragic 1.5% |
| Chippewa | 0.9 /100 | #257 | Tragic 1.5% |
| Immigrants | West Indies | 0.9 /100 | #258 | Tragic 1.5% |
| Liberians | 0.9 /100 | #259 | Tragic 1.5% |
| Japanese | 0.9 /100 | #260 | Tragic 1.5% |
| Immigrants | Portugal | 0.8 /100 | #261 | Tragic 1.5% |
| Chickasaw | 0.7 /100 | #262 | Tragic 1.5% |
| Immigrants | Bahamas | 0.7 /100 | #263 | Tragic 1.5% |
| Blackfeet | 0.7 /100 | #264 | Tragic 1.5% |
| Nicaraguans | 0.6 /100 | #265 | Tragic 1.5% |
| Immigrants | Liberia | 0.5 /100 | #266 | Tragic 1.5% |
Demographics Similar to Australians by Doctorate Degree
In terms of doctorate degree, the demographic groups most similar to Australians are Immigrants from Norway (2.4%, a difference of 0.090%), Bulgarian (2.4%, a difference of 0.47%), Immigrants from Latvia (2.4%, a difference of 0.59%), Immigrants from Asia (2.4%, a difference of 1.2%), and Immigrants from Indonesia (2.4%, a difference of 1.3%).
| Demographics | Rating | Rank | Doctorate Degree |
| Immigrants | Netherlands | 100.0 /100 | #44 | Exceptional 2.5% |
| Immigrants | South Africa | 100.0 /100 | #45 | Exceptional 2.4% |
| Immigrants | Austria | 100.0 /100 | #46 | Exceptional 2.4% |
| Immigrants | Western Europe | 100.0 /100 | #47 | Exceptional 2.4% |
| Asians | 100.0 /100 | #48 | Exceptional 2.4% |
| Immigrants | Asia | 100.0 /100 | #49 | Exceptional 2.4% |
| Immigrants | Norway | 100.0 /100 | #50 | Exceptional 2.4% |
| Australians | 100.0 /100 | #51 | Exceptional 2.4% |
| Bulgarians | 100.0 /100 | #52 | Exceptional 2.4% |
| Immigrants | Latvia | 100.0 /100 | #53 | Exceptional 2.4% |
| Immigrants | Indonesia | 100.0 /100 | #54 | Exceptional 2.4% |
| Bolivians | 100.0 /100 | #55 | Exceptional 2.4% |
| Immigrants | Czechoslovakia | 100.0 /100 | #56 | Exceptional 2.4% |
| Immigrants | Ethiopia | 100.0 /100 | #57 | Exceptional 2.4% |
| Ethiopians | 99.9 /100 | #58 | Exceptional 2.3% |