Laotian vs Assyrian/Chaldean/Syriac Male Unemployment
COMPARE
Laotian
Assyrian/Chaldean/Syriac
Male Unemployment
Male Unemployment Comparison
Laotians
Assyrians/Chaldeans/Syriacs
5.2%
MALE UNEMPLOYMENT
73.8/ 100
METRIC RATING
154th/ 347
METRIC RANK
5.0%
MALE UNEMPLOYMENT
96.9/ 100
METRIC RATING
75th/ 347
METRIC RANK
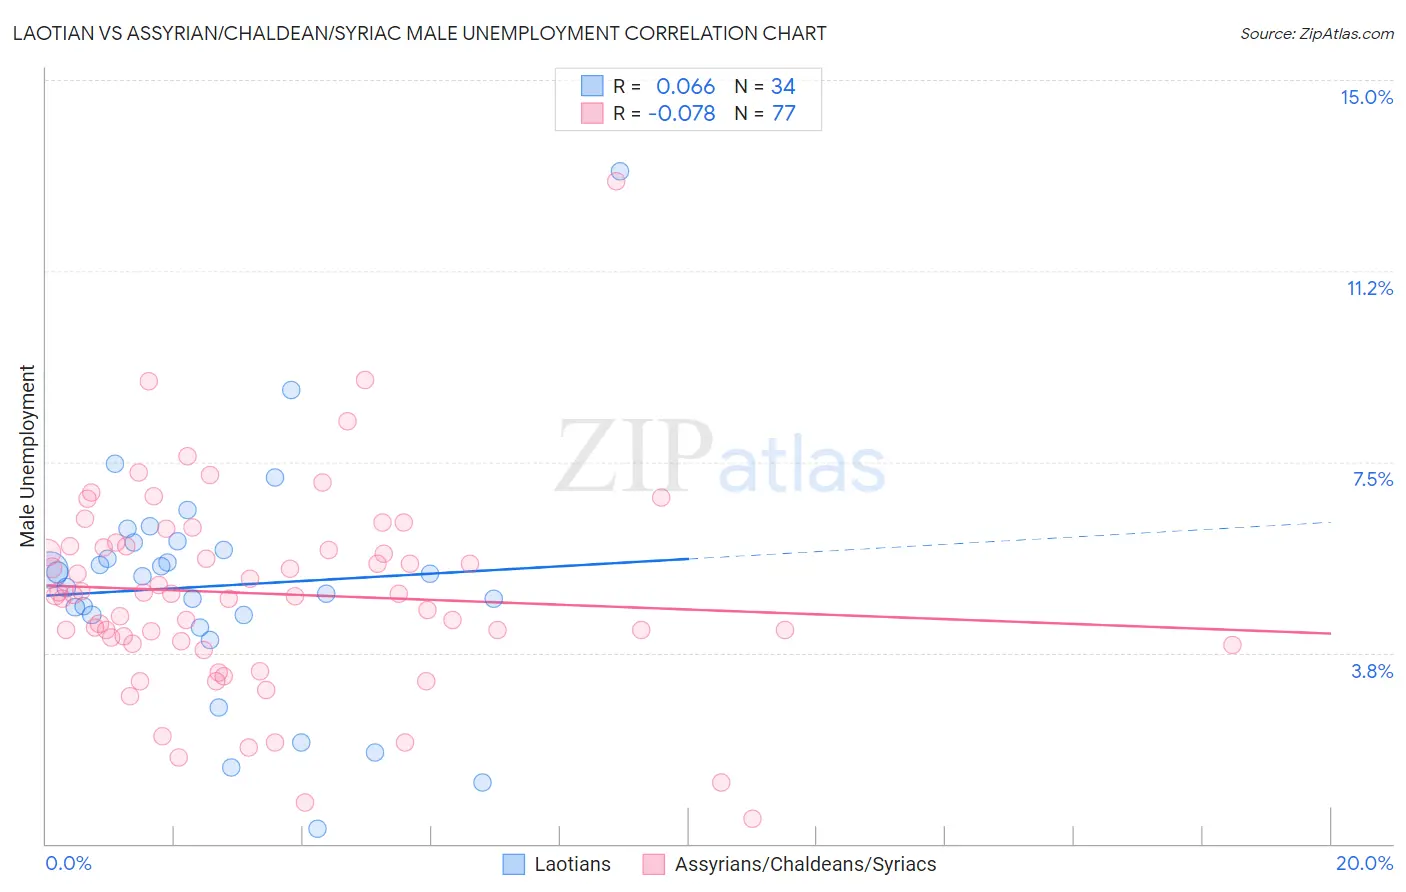
Laotian vs Assyrian/Chaldean/Syriac Male Unemployment Correlation Chart
The statistical analysis conducted on geographies consisting of 224,510,892 people shows a slight positive correlation between the proportion of Laotians and unemployment rate among males in the United States with a correlation coefficient (R) of 0.066 and weighted average of 5.2%. Similarly, the statistical analysis conducted on geographies consisting of 110,205,366 people shows a slight negative correlation between the proportion of Assyrians/Chaldeans/Syriacs and unemployment rate among males in the United States with a correlation coefficient (R) of -0.078 and weighted average of 5.0%, a difference of 3.7%.
Male Unemployment Correlation Summary
| Measurement | Laotian | Assyrian/Chaldean/Syriac |
| Minimum | 0.30% | 0.50% |
| Maximum | 13.2% | 13.0% |
| Range | 12.9% | 12.5% |
| Mean | 5.1% | 4.9% |
| Median | 5.3% | 4.9% |
| Interquartile 25% (IQ1) | 4.5% | 3.9% |
| Interquartile 75% (IQ3) | 5.9% | 5.8% |
| Interquartile Range (IQR) | 1.4% | 1.9% |
| Standard Deviation (Sample) | 2.3% | 2.0% |
| Standard Deviation (Population) | 2.3% | 2.0% |
Similar Demographics by Male Unemployment
Demographics Similar to Laotians by Male Unemployment
In terms of male unemployment, the demographic groups most similar to Laotians are Immigrants from Uruguay (5.2%, a difference of 0.010%), Immigrants from Hungary (5.2%, a difference of 0.030%), Egyptian (5.2%, a difference of 0.080%), American (5.2%, a difference of 0.090%), and Immigrants from Northern Africa (5.2%, a difference of 0.12%).
| Demographics | Rating | Rank | Male Unemployment |
| Immigrants | Burma/Myanmar | 77.5 /100 | #147 | Good 5.2% |
| Immigrants | Italy | 76.3 /100 | #148 | Good 5.2% |
| Immigrants | Europe | 76.2 /100 | #149 | Good 5.2% |
| Indians (Asian) | 76.0 /100 | #150 | Good 5.2% |
| Slovaks | 75.5 /100 | #151 | Good 5.2% |
| Egyptians | 74.8 /100 | #152 | Good 5.2% |
| Immigrants | Uruguay | 73.9 /100 | #153 | Good 5.2% |
| Laotians | 73.8 /100 | #154 | Good 5.2% |
| Immigrants | Hungary | 73.4 /100 | #155 | Good 5.2% |
| Americans | 72.7 /100 | #156 | Good 5.2% |
| Immigrants | Northern Africa | 72.3 /100 | #157 | Good 5.2% |
| Immigrants | Indonesia | 71.5 /100 | #158 | Good 5.2% |
| Indonesians | 71.2 /100 | #159 | Good 5.2% |
| Immigrants | Norway | 71.0 /100 | #160 | Good 5.2% |
| Immigrants | China | 70.6 /100 | #161 | Good 5.2% |
Demographics Similar to Assyrians/Chaldeans/Syriacs by Male Unemployment
In terms of male unemployment, the demographic groups most similar to Assyrians/Chaldeans/Syriacs are Immigrants from North America (5.0%, a difference of 0.030%), Greek (5.0%, a difference of 0.060%), Immigrants from South Africa (5.0%, a difference of 0.14%), Immigrants from Sudan (5.0%, a difference of 0.16%), and Iranian (5.0%, a difference of 0.21%).
| Demographics | Rating | Rank | Male Unemployment |
| Australians | 97.4 /100 | #68 | Exceptional 5.0% |
| Immigrants | Sweden | 97.4 /100 | #69 | Exceptional 5.0% |
| Whites/Caucasians | 97.3 /100 | #70 | Exceptional 5.0% |
| New Zealanders | 97.3 /100 | #71 | Exceptional 5.0% |
| Immigrants | South Africa | 97.1 /100 | #72 | Exceptional 5.0% |
| Greeks | 97.0 /100 | #73 | Exceptional 5.0% |
| Immigrants | North America | 96.9 /100 | #74 | Exceptional 5.0% |
| Assyrians/Chaldeans/Syriacs | 96.9 /100 | #75 | Exceptional 5.0% |
| Immigrants | Sudan | 96.5 /100 | #76 | Exceptional 5.0% |
| Iranians | 96.4 /100 | #77 | Exceptional 5.0% |
| Immigrants | Northern Europe | 96.4 /100 | #78 | Exceptional 5.0% |
| South Africans | 96.4 /100 | #79 | Exceptional 5.0% |
| Argentineans | 96.2 /100 | #80 | Exceptional 5.0% |
| French | 96.2 /100 | #81 | Exceptional 5.0% |
| Chileans | 96.2 /100 | #82 | Exceptional 5.0% |