Korean vs Immigrants from Jordan Male Unemployment
COMPARE
Korean
Immigrants from Jordan
Male Unemployment
Male Unemployment Comparison
Koreans
Immigrants from Jordan
5.3%
MALE UNEMPLOYMENT
34.9/ 100
METRIC RATING
185th/ 347
METRIC RANK
5.1%
MALE UNEMPLOYMENT
91.9/ 100
METRIC RATING
103rd/ 347
METRIC RANK
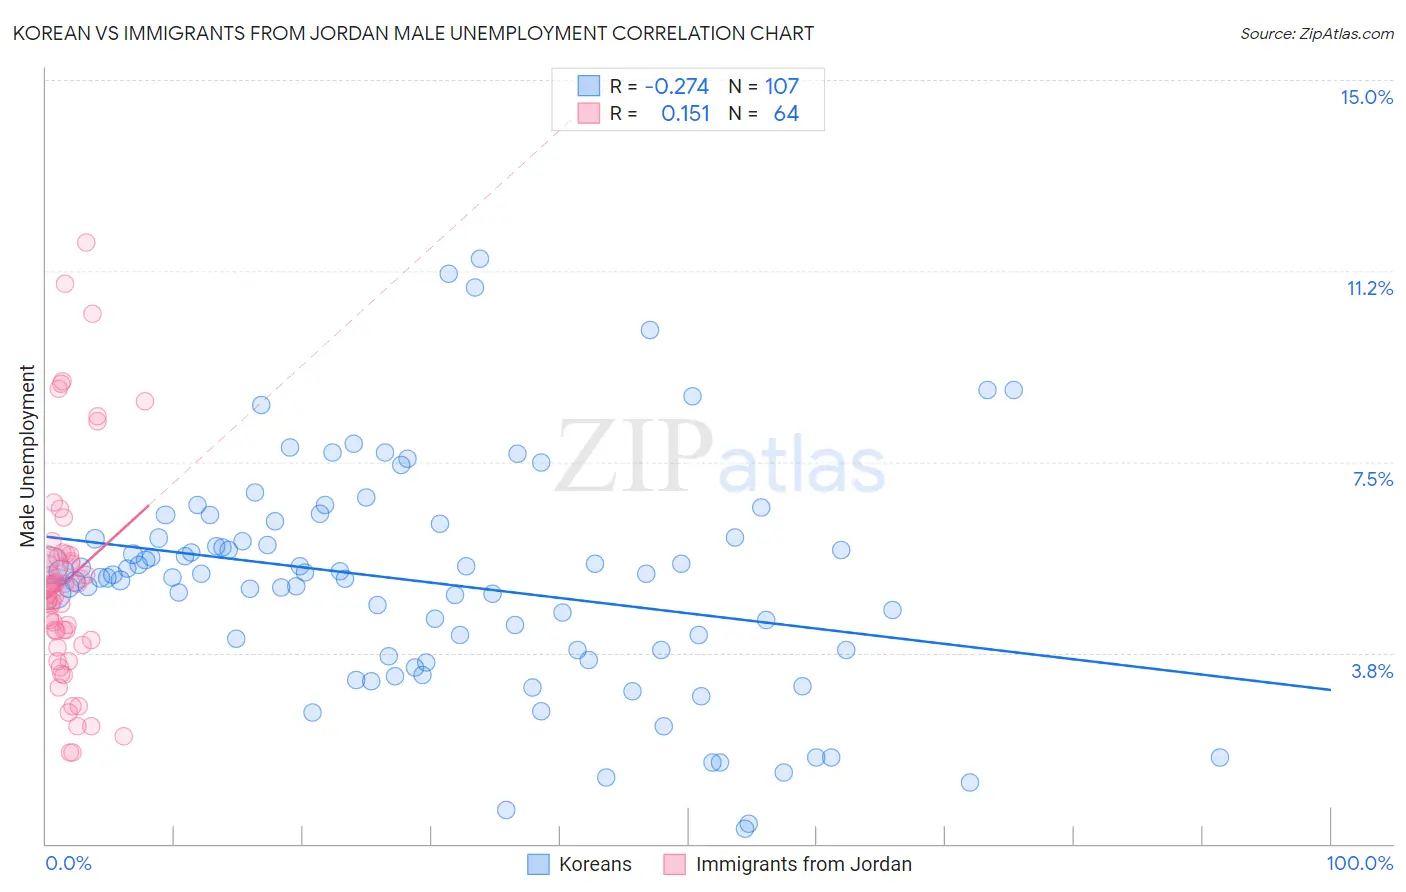
Korean vs Immigrants from Jordan Male Unemployment Correlation Chart
The statistical analysis conducted on geographies consisting of 506,883,728 people shows a weak negative correlation between the proportion of Koreans and unemployment rate among males in the United States with a correlation coefficient (R) of -0.274 and weighted average of 5.3%. Similarly, the statistical analysis conducted on geographies consisting of 181,155,551 people shows a poor positive correlation between the proportion of Immigrants from Jordan and unemployment rate among males in the United States with a correlation coefficient (R) of 0.151 and weighted average of 5.1%, a difference of 4.6%.
Male Unemployment Correlation Summary
| Measurement | Korean | Immigrants from Jordan |
| Minimum | 0.30% | 1.8% |
| Maximum | 11.5% | 11.8% |
| Range | 11.2% | 10.0% |
| Mean | 5.1% | 5.2% |
| Median | 5.3% | 5.0% |
| Interquartile 25% (IQ1) | 3.8% | 4.0% |
| Interquartile 75% (IQ3) | 6.0% | 5.6% |
| Interquartile Range (IQR) | 2.2% | 1.7% |
| Standard Deviation (Sample) | 2.2% | 2.1% |
| Standard Deviation (Population) | 2.2% | 2.1% |
Similar Demographics by Male Unemployment
Demographics Similar to Koreans by Male Unemployment
In terms of male unemployment, the demographic groups most similar to Koreans are Spaniard (5.3%, a difference of 0.010%), Taiwanese (5.3%, a difference of 0.17%), Potawatomi (5.3%, a difference of 0.18%), Immigrants from Afghanistan (5.3%, a difference of 0.19%), and Iraqi (5.4%, a difference of 0.22%).
| Demographics | Rating | Rank | Male Unemployment |
| Osage | 42.5 /100 | #178 | Average 5.3% |
| Immigrants | Oceania | 40.8 /100 | #179 | Average 5.3% |
| Malaysians | 39.6 /100 | #180 | Fair 5.3% |
| Immigrants | Afghanistan | 37.9 /100 | #181 | Fair 5.3% |
| Potawatomi | 37.8 /100 | #182 | Fair 5.3% |
| Taiwanese | 37.6 /100 | #183 | Fair 5.3% |
| Spaniards | 35.1 /100 | #184 | Fair 5.3% |
| Koreans | 34.9 /100 | #185 | Fair 5.3% |
| Iraqis | 31.6 /100 | #186 | Fair 5.4% |
| Costa Ricans | 31.3 /100 | #187 | Fair 5.4% |
| Arabs | 30.2 /100 | #188 | Fair 5.4% |
| Immigrants | South America | 29.4 /100 | #189 | Fair 5.4% |
| Immigrants | Uganda | 28.8 /100 | #190 | Fair 5.4% |
| Immigrants | South Eastern Asia | 28.2 /100 | #191 | Fair 5.4% |
| Immigrants | Belarus | 26.0 /100 | #192 | Fair 5.4% |
Demographics Similar to Immigrants from Jordan by Male Unemployment
In terms of male unemployment, the demographic groups most similar to Immigrants from Jordan are Immigrants from Chile (5.1%, a difference of 0.030%), Immigrants from Czechoslovakia (5.1%, a difference of 0.040%), Immigrants from Ethiopia (5.1%, a difference of 0.080%), Ethiopian (5.1%, a difference of 0.12%), and Immigrants from Nicaragua (5.1%, a difference of 0.13%).
| Demographics | Rating | Rank | Male Unemployment |
| Asians | 93.7 /100 | #96 | Exceptional 5.1% |
| Immigrants | Spain | 93.4 /100 | #97 | Exceptional 5.1% |
| Immigrants | Kuwait | 93.3 /100 | #98 | Exceptional 5.1% |
| Uruguayans | 93.0 /100 | #99 | Exceptional 5.1% |
| Russians | 92.9 /100 | #100 | Exceptional 5.1% |
| German Russians | 92.7 /100 | #101 | Exceptional 5.1% |
| Immigrants | France | 92.7 /100 | #102 | Exceptional 5.1% |
| Immigrants | Jordan | 91.9 /100 | #103 | Exceptional 5.1% |
| Immigrants | Chile | 91.8 /100 | #104 | Exceptional 5.1% |
| Immigrants | Czechoslovakia | 91.7 /100 | #105 | Exceptional 5.1% |
| Immigrants | Ethiopia | 91.5 /100 | #106 | Exceptional 5.1% |
| Ethiopians | 91.3 /100 | #107 | Exceptional 5.1% |
| Immigrants | Nicaragua | 91.2 /100 | #108 | Exceptional 5.1% |
| Immigrants | Pakistan | 90.9 /100 | #109 | Exceptional 5.1% |
| Immigrants | England | 90.8 /100 | #110 | Exceptional 5.1% |