Mongolian vs Immigrants from Jordan Male Unemployment
COMPARE
Mongolian
Immigrants from Jordan
Male Unemployment
Male Unemployment Comparison
Mongolians
Immigrants from Jordan
5.1%
MALE UNEMPLOYMENT
88.4/ 100
METRIC RATING
121st/ 347
METRIC RANK
5.1%
MALE UNEMPLOYMENT
91.9/ 100
METRIC RATING
103rd/ 347
METRIC RANK
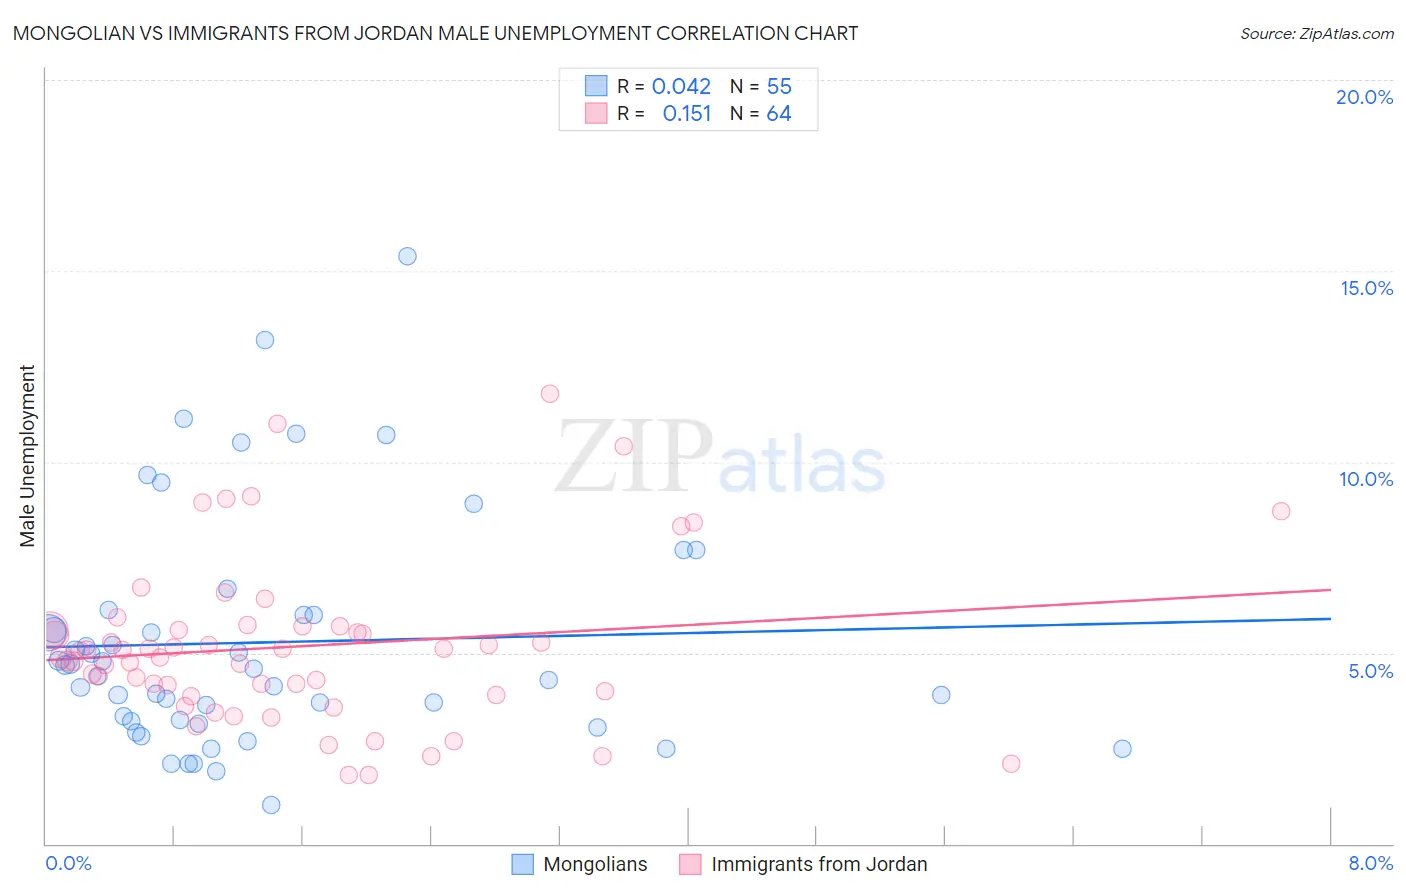
Mongolian vs Immigrants from Jordan Male Unemployment Correlation Chart
The statistical analysis conducted on geographies consisting of 140,285,925 people shows no correlation between the proportion of Mongolians and unemployment rate among males in the United States with a correlation coefficient (R) of 0.042 and weighted average of 5.1%. Similarly, the statistical analysis conducted on geographies consisting of 181,155,551 people shows a poor positive correlation between the proportion of Immigrants from Jordan and unemployment rate among males in the United States with a correlation coefficient (R) of 0.151 and weighted average of 5.1%, a difference of 0.61%.
Male Unemployment Correlation Summary
| Measurement | Mongolian | Immigrants from Jordan |
| Minimum | 1.0% | 1.8% |
| Maximum | 15.4% | 11.8% |
| Range | 14.4% | 10.0% |
| Mean | 5.3% | 5.2% |
| Median | 4.6% | 5.0% |
| Interquartile 25% (IQ1) | 3.2% | 4.0% |
| Interquartile 75% (IQ3) | 6.0% | 5.6% |
| Interquartile Range (IQR) | 2.8% | 1.7% |
| Standard Deviation (Sample) | 3.0% | 2.1% |
| Standard Deviation (Population) | 3.0% | 2.1% |
Demographics Similar to Mongolians and Immigrants from Jordan by Male Unemployment
In terms of male unemployment, the demographic groups most similar to Mongolians are Ukrainian (5.1%, a difference of 0.010%), French Canadian (5.1%, a difference of 0.030%), Nicaraguan (5.1%, a difference of 0.030%), Cypriot (5.1%, a difference of 0.070%), and Estonian (5.1%, a difference of 0.10%). Similarly, the demographic groups most similar to Immigrants from Jordan are Immigrants from Chile (5.1%, a difference of 0.030%), Immigrants from Czechoslovakia (5.1%, a difference of 0.040%), Immigrants from Ethiopia (5.1%, a difference of 0.080%), Ethiopian (5.1%, a difference of 0.12%), and Immigrants from Nicaragua (5.1%, a difference of 0.13%).
| Demographics | Rating | Rank | Male Unemployment |
| Immigrants | France | 92.7 /100 | #102 | Exceptional 5.1% |
| Immigrants | Jordan | 91.9 /100 | #103 | Exceptional 5.1% |
| Immigrants | Chile | 91.8 /100 | #104 | Exceptional 5.1% |
| Immigrants | Czechoslovakia | 91.7 /100 | #105 | Exceptional 5.1% |
| Immigrants | Ethiopia | 91.5 /100 | #106 | Exceptional 5.1% |
| Ethiopians | 91.3 /100 | #107 | Exceptional 5.1% |
| Immigrants | Nicaragua | 91.2 /100 | #108 | Exceptional 5.1% |
| Immigrants | Pakistan | 90.9 /100 | #109 | Exceptional 5.1% |
| Immigrants | England | 90.8 /100 | #110 | Exceptional 5.1% |
| Immigrants | Eastern Asia | 90.8 /100 | #111 | Exceptional 5.1% |
| Immigrants | Moldova | 90.3 /100 | #112 | Exceptional 5.1% |
| Immigrants | Austria | 90.3 /100 | #113 | Exceptional 5.1% |
| Romanians | 89.8 /100 | #114 | Excellent 5.1% |
| Immigrants | Asia | 89.6 /100 | #115 | Excellent 5.1% |
| Immigrants | Denmark | 89.4 /100 | #116 | Excellent 5.1% |
| Estonians | 89.0 /100 | #117 | Excellent 5.1% |
| Cypriots | 88.8 /100 | #118 | Excellent 5.1% |
| French Canadians | 88.6 /100 | #119 | Excellent 5.1% |
| Ukrainians | 88.4 /100 | #120 | Excellent 5.1% |
| Mongolians | 88.4 /100 | #121 | Excellent 5.1% |
| Nicaraguans | 88.2 /100 | #122 | Excellent 5.1% |