Korean vs Immigrants from Cambodia Male Unemployment
COMPARE
Korean
Immigrants from Cambodia
Male Unemployment
Male Unemployment Comparison
Koreans
Immigrants from Cambodia
5.3%
MALE UNEMPLOYMENT
34.9/ 100
METRIC RATING
185th/ 347
METRIC RANK
5.6%
MALE UNEMPLOYMENT
1.8/ 100
METRIC RATING
226th/ 347
METRIC RANK
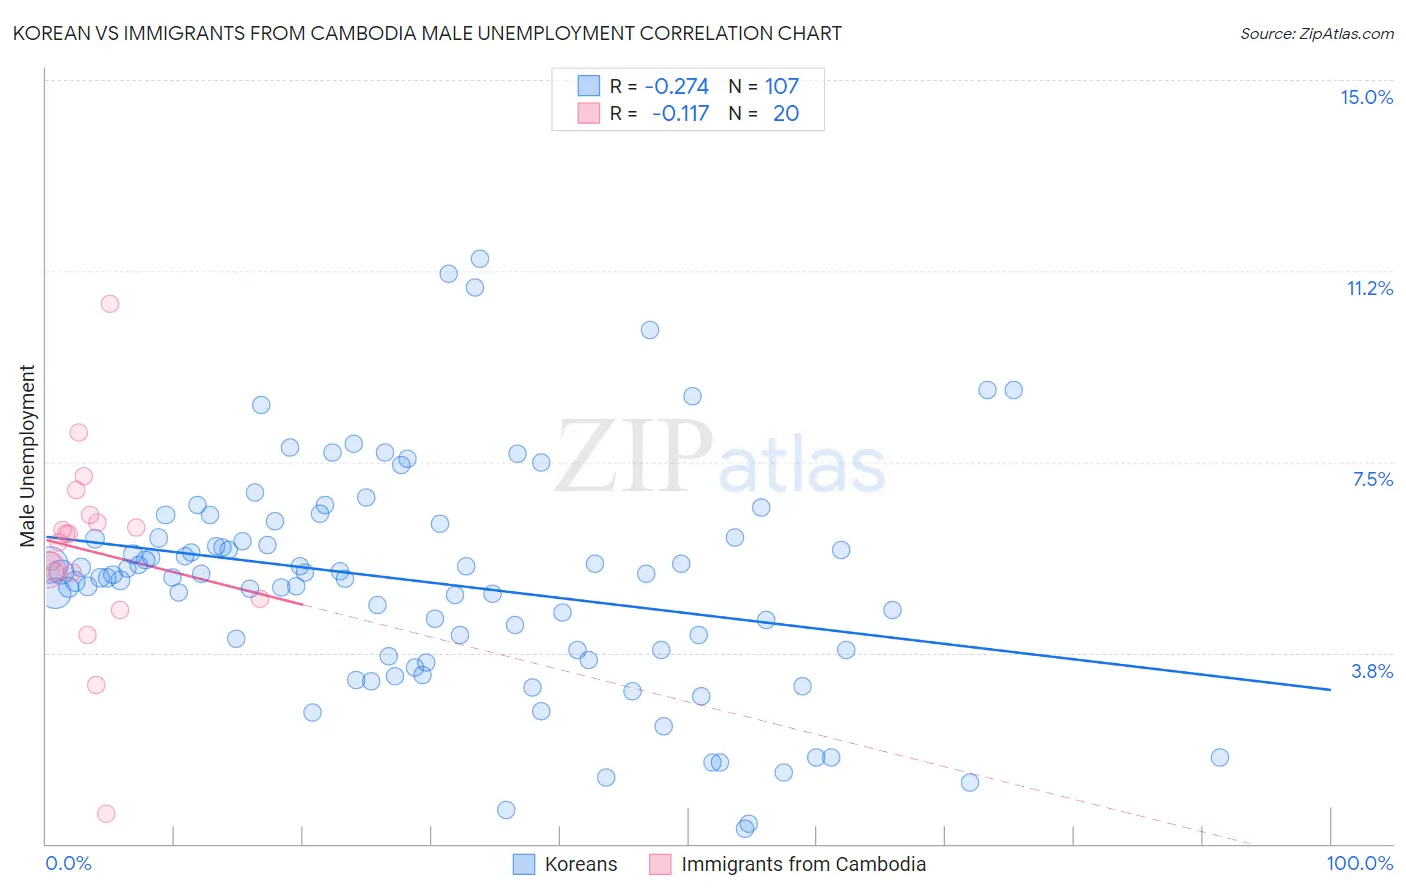
Korean vs Immigrants from Cambodia Male Unemployment Correlation Chart
The statistical analysis conducted on geographies consisting of 506,883,728 people shows a weak negative correlation between the proportion of Koreans and unemployment rate among males in the United States with a correlation coefficient (R) of -0.274 and weighted average of 5.3%. Similarly, the statistical analysis conducted on geographies consisting of 204,980,262 people shows a poor negative correlation between the proportion of Immigrants from Cambodia and unemployment rate among males in the United States with a correlation coefficient (R) of -0.117 and weighted average of 5.6%, a difference of 4.9%.
Male Unemployment Correlation Summary
| Measurement | Korean | Immigrants from Cambodia |
| Minimum | 0.30% | 0.60% |
| Maximum | 11.5% | 10.6% |
| Range | 11.2% | 10.0% |
| Mean | 5.1% | 5.7% |
| Median | 5.3% | 6.0% |
| Interquartile 25% (IQ1) | 3.8% | 5.1% |
| Interquartile 75% (IQ3) | 6.0% | 6.4% |
| Interquartile Range (IQR) | 2.2% | 1.3% |
| Standard Deviation (Sample) | 2.2% | 2.0% |
| Standard Deviation (Population) | 2.2% | 1.9% |
Similar Demographics by Male Unemployment
Demographics Similar to Koreans by Male Unemployment
In terms of male unemployment, the demographic groups most similar to Koreans are Spaniard (5.3%, a difference of 0.010%), Taiwanese (5.3%, a difference of 0.17%), Potawatomi (5.3%, a difference of 0.18%), Immigrants from Afghanistan (5.3%, a difference of 0.19%), and Iraqi (5.4%, a difference of 0.22%).
| Demographics | Rating | Rank | Male Unemployment |
| Osage | 42.5 /100 | #178 | Average 5.3% |
| Immigrants | Oceania | 40.8 /100 | #179 | Average 5.3% |
| Malaysians | 39.6 /100 | #180 | Fair 5.3% |
| Immigrants | Afghanistan | 37.9 /100 | #181 | Fair 5.3% |
| Potawatomi | 37.8 /100 | #182 | Fair 5.3% |
| Taiwanese | 37.6 /100 | #183 | Fair 5.3% |
| Spaniards | 35.1 /100 | #184 | Fair 5.3% |
| Koreans | 34.9 /100 | #185 | Fair 5.3% |
| Iraqis | 31.6 /100 | #186 | Fair 5.4% |
| Costa Ricans | 31.3 /100 | #187 | Fair 5.4% |
| Arabs | 30.2 /100 | #188 | Fair 5.4% |
| Immigrants | South America | 29.4 /100 | #189 | Fair 5.4% |
| Immigrants | Uganda | 28.8 /100 | #190 | Fair 5.4% |
| Immigrants | South Eastern Asia | 28.2 /100 | #191 | Fair 5.4% |
| Immigrants | Belarus | 26.0 /100 | #192 | Fair 5.4% |
Demographics Similar to Immigrants from Cambodia by Male Unemployment
In terms of male unemployment, the demographic groups most similar to Immigrants from Cambodia are Immigrants from Panama (5.6%, a difference of 0.0%), Seminole (5.6%, a difference of 0.020%), Central American (5.6%, a difference of 0.030%), Immigrants from Africa (5.6%, a difference of 0.060%), and Panamanian (5.6%, a difference of 0.090%).
| Demographics | Rating | Rank | Male Unemployment |
| Immigrants | Western Asia | 3.5 /100 | #219 | Tragic 5.6% |
| Portuguese | 3.5 /100 | #220 | Tragic 5.6% |
| Soviet Union | 3.2 /100 | #221 | Tragic 5.6% |
| Immigrants | Micronesia | 2.9 /100 | #222 | Tragic 5.6% |
| Creek | 2.6 /100 | #223 | Tragic 5.6% |
| Cherokee | 2.4 /100 | #224 | Tragic 5.6% |
| Panamanians | 1.9 /100 | #225 | Tragic 5.6% |
| Immigrants | Cambodia | 1.8 /100 | #226 | Tragic 5.6% |
| Immigrants | Panama | 1.8 /100 | #227 | Tragic 5.6% |
| Seminole | 1.8 /100 | #228 | Tragic 5.6% |
| Central Americans | 1.8 /100 | #229 | Tragic 5.6% |
| Immigrants | Africa | 1.7 /100 | #230 | Tragic 5.6% |
| Choctaw | 1.6 /100 | #231 | Tragic 5.6% |
| Moroccans | 1.6 /100 | #232 | Tragic 5.6% |
| Somalis | 1.5 /100 | #233 | Tragic 5.6% |