Indian (Asian) vs Osage Unemployment Among Ages 30 to 34 years
COMPARE
Indian (Asian)
Osage
Unemployment Among Ages 30 to 34 years
Unemployment Among Ages 30 to 34 years Comparison
Indians (Asian)
Osage
5.1%
UNEMPLOYMENT AMONG AGES 30 TO 34 YEARS
97.0/ 100
METRIC RATING
61st/ 347
METRIC RANK
6.3%
UNEMPLOYMENT AMONG AGES 30 TO 34 YEARS
0.0/ 100
METRIC RATING
278th/ 347
METRIC RANK
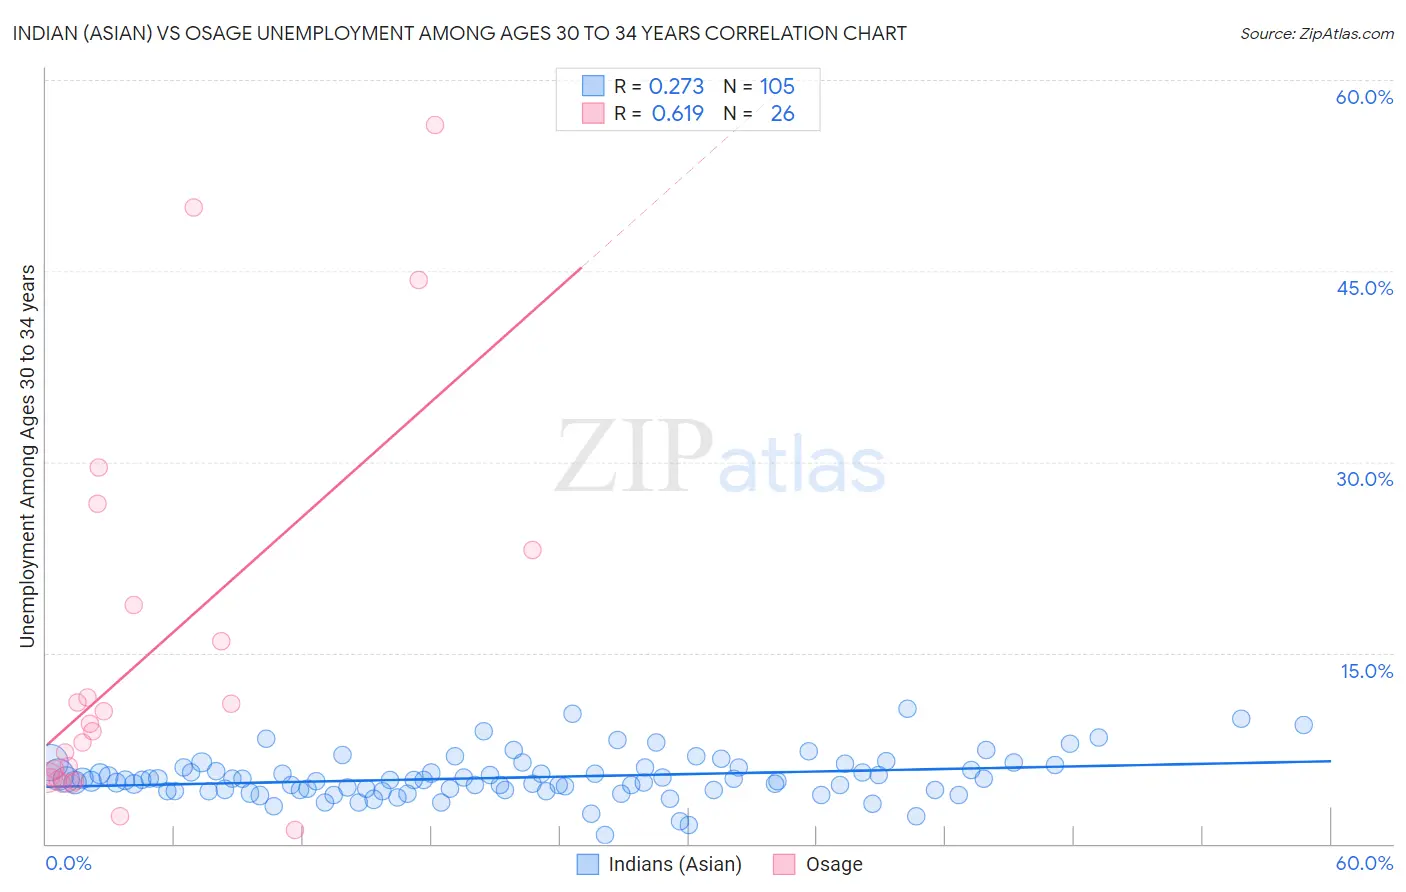
Indian (Asian) vs Osage Unemployment Among Ages 30 to 34 years Correlation Chart
The statistical analysis conducted on geographies consisting of 455,312,622 people shows a weak positive correlation between the proportion of Indians (Asian) and unemployment rate among population between the ages 30 and 34 in the United States with a correlation coefficient (R) of 0.273 and weighted average of 5.1%. Similarly, the statistical analysis conducted on geographies consisting of 89,714,543 people shows a significant positive correlation between the proportion of Osage and unemployment rate among population between the ages 30 and 34 in the United States with a correlation coefficient (R) of 0.619 and weighted average of 6.3%, a difference of 23.5%.
Unemployment Among Ages 30 to 34 years Correlation Summary
| Measurement | Indian (Asian) | Osage |
| Minimum | 0.70% | 1.1% |
| Maximum | 10.6% | 56.5% |
| Range | 9.9% | 55.4% |
| Mean | 5.2% | 14.9% |
| Median | 5.0% | 9.1% |
| Interquartile 25% (IQ1) | 4.2% | 5.2% |
| Interquartile 75% (IQ3) | 6.0% | 18.8% |
| Interquartile Range (IQR) | 1.8% | 13.6% |
| Standard Deviation (Sample) | 1.7% | 15.0% |
| Standard Deviation (Population) | 1.7% | 14.7% |
Similar Demographics by Unemployment Among Ages 30 to 34 years
Demographics Similar to Indians (Asian) by Unemployment Among Ages 30 to 34 years
In terms of unemployment among ages 30 to 34 years, the demographic groups most similar to Indians (Asian) are Immigrants from France (5.1%, a difference of 0.020%), Swedish (5.1%, a difference of 0.030%), Immigrants from Somalia (5.1%, a difference of 0.030%), Belgian (5.1%, a difference of 0.030%), and Immigrants from Eastern Asia (5.1%, a difference of 0.050%).
| Demographics | Rating | Rank | Unemployment Among Ages 30 to 34 years |
| Immigrants | Morocco | 97.9 /100 | #54 | Exceptional 5.1% |
| Chinese | 97.7 /100 | #55 | Exceptional 5.1% |
| Immigrants | Serbia | 97.4 /100 | #56 | Exceptional 5.1% |
| Immigrants | China | 97.2 /100 | #57 | Exceptional 5.1% |
| Asians | 97.2 /100 | #58 | Exceptional 5.1% |
| Swedes | 97.1 /100 | #59 | Exceptional 5.1% |
| Immigrants | Somalia | 97.1 /100 | #60 | Exceptional 5.1% |
| Indians (Asian) | 97.0 /100 | #61 | Exceptional 5.1% |
| Immigrants | France | 97.0 /100 | #62 | Exceptional 5.1% |
| Belgians | 97.0 /100 | #63 | Exceptional 5.1% |
| Immigrants | Eastern Asia | 96.9 /100 | #64 | Exceptional 5.1% |
| Immigrants | Japan | 96.8 /100 | #65 | Exceptional 5.1% |
| Immigrants | Zimbabwe | 96.7 /100 | #66 | Exceptional 5.1% |
| Burmese | 96.5 /100 | #67 | Exceptional 5.1% |
| Jordanians | 96.5 /100 | #68 | Exceptional 5.1% |
Demographics Similar to Osage by Unemployment Among Ages 30 to 34 years
In terms of unemployment among ages 30 to 34 years, the demographic groups most similar to Osage are Immigrants from Ecuador (6.3%, a difference of 0.080%), Cree (6.4%, a difference of 0.48%), Cherokee (6.4%, a difference of 0.52%), Pennsylvania German (6.3%, a difference of 0.82%), and Immigrants from Caribbean (6.4%, a difference of 0.84%).
| Demographics | Rating | Rank | Unemployment Among Ages 30 to 34 years |
| Comanche | 0.0 /100 | #271 | Tragic 6.3% |
| Blackfeet | 0.0 /100 | #272 | Tragic 6.3% |
| Ottawa | 0.0 /100 | #273 | Tragic 6.3% |
| U.S. Virgin Islanders | 0.0 /100 | #274 | Tragic 6.3% |
| Ecuadorians | 0.0 /100 | #275 | Tragic 6.3% |
| Pennsylvania Germans | 0.0 /100 | #276 | Tragic 6.3% |
| Immigrants | Ecuador | 0.0 /100 | #277 | Tragic 6.3% |
| Osage | 0.0 /100 | #278 | Tragic 6.3% |
| Cree | 0.0 /100 | #279 | Tragic 6.4% |
| Cherokee | 0.0 /100 | #280 | Tragic 6.4% |
| Immigrants | Caribbean | 0.0 /100 | #281 | Tragic 6.4% |
| Africans | 0.0 /100 | #282 | Tragic 6.4% |
| Hispanics or Latinos | 0.0 /100 | #283 | Tragic 6.4% |
| Immigrants | Bangladesh | 0.0 /100 | #284 | Tragic 6.4% |
| Choctaw | 0.0 /100 | #285 | Tragic 6.4% |