Indian (Asian) vs Delaware Unemployment Among Ages 30 to 34 years
COMPARE
Indian (Asian)
Delaware
Unemployment Among Ages 30 to 34 years
Unemployment Among Ages 30 to 34 years Comparison
Indians (Asian)
Delaware
5.1%
UNEMPLOYMENT AMONG AGES 30 TO 34 YEARS
97.0/ 100
METRIC RATING
61st/ 347
METRIC RANK
6.7%
UNEMPLOYMENT AMONG AGES 30 TO 34 YEARS
0.0/ 100
METRIC RATING
302nd/ 347
METRIC RANK
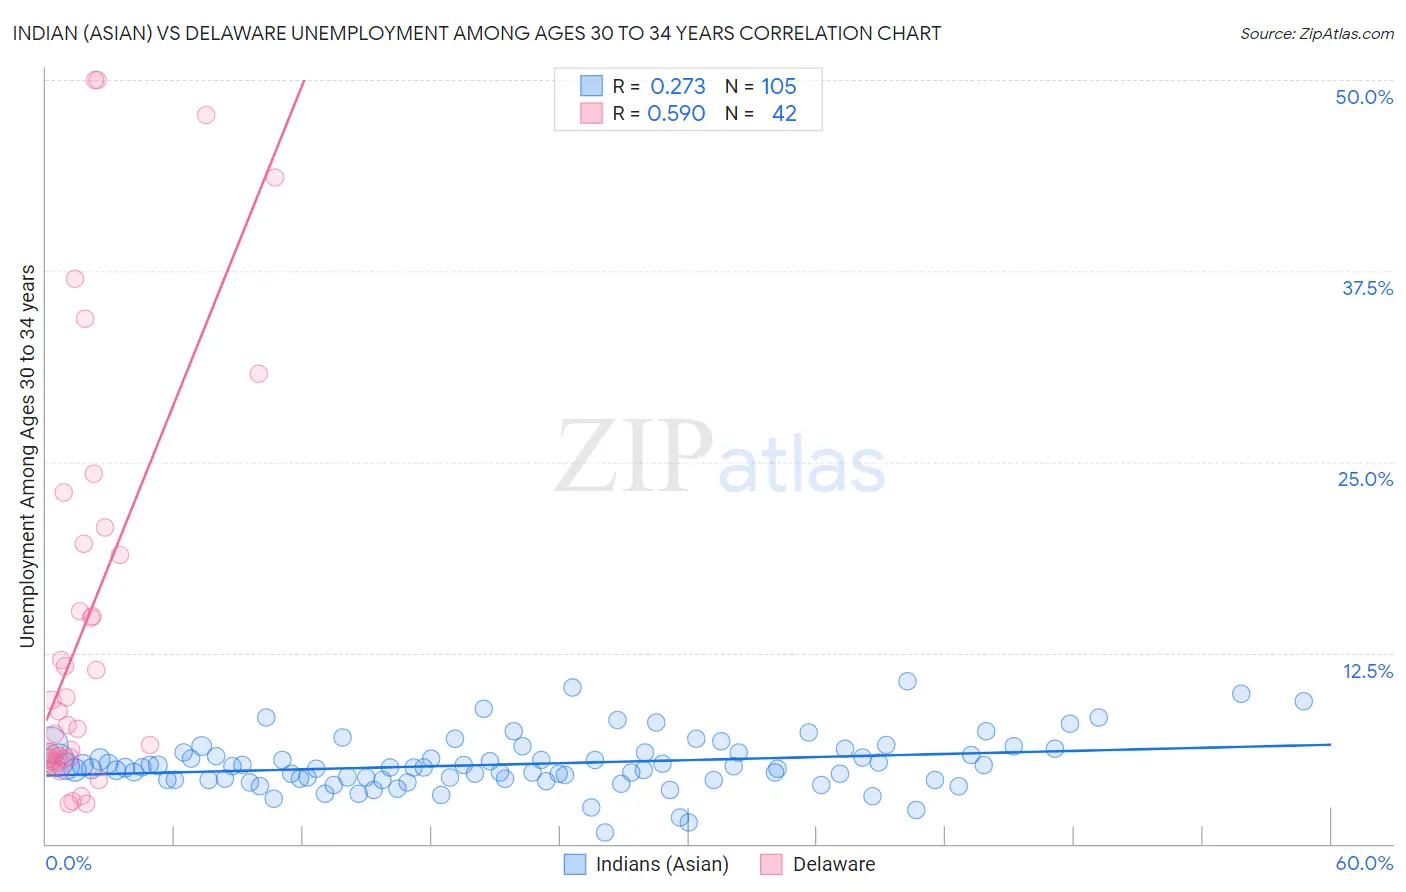
Indian (Asian) vs Delaware Unemployment Among Ages 30 to 34 years Correlation Chart
The statistical analysis conducted on geographies consisting of 455,312,622 people shows a weak positive correlation between the proportion of Indians (Asian) and unemployment rate among population between the ages 30 and 34 in the United States with a correlation coefficient (R) of 0.273 and weighted average of 5.1%. Similarly, the statistical analysis conducted on geographies consisting of 93,963,803 people shows a substantial positive correlation between the proportion of Delaware and unemployment rate among population between the ages 30 and 34 in the United States with a correlation coefficient (R) of 0.590 and weighted average of 6.7%, a difference of 29.7%.
Unemployment Among Ages 30 to 34 years Correlation Summary
| Measurement | Indian (Asian) | Delaware |
| Minimum | 0.70% | 2.6% |
| Maximum | 10.6% | 50.0% |
| Range | 9.9% | 47.4% |
| Mean | 5.2% | 14.7% |
| Median | 5.0% | 8.2% |
| Interquartile 25% (IQ1) | 4.2% | 5.6% |
| Interquartile 75% (IQ3) | 6.0% | 19.7% |
| Interquartile Range (IQR) | 1.8% | 14.1% |
| Standard Deviation (Sample) | 1.7% | 13.8% |
| Standard Deviation (Population) | 1.7% | 13.7% |
Similar Demographics by Unemployment Among Ages 30 to 34 years
Demographics Similar to Indians (Asian) by Unemployment Among Ages 30 to 34 years
In terms of unemployment among ages 30 to 34 years, the demographic groups most similar to Indians (Asian) are Immigrants from France (5.1%, a difference of 0.020%), Swedish (5.1%, a difference of 0.030%), Immigrants from Somalia (5.1%, a difference of 0.030%), Belgian (5.1%, a difference of 0.030%), and Immigrants from Eastern Asia (5.1%, a difference of 0.050%).
| Demographics | Rating | Rank | Unemployment Among Ages 30 to 34 years |
| Immigrants | Morocco | 97.9 /100 | #54 | Exceptional 5.1% |
| Chinese | 97.7 /100 | #55 | Exceptional 5.1% |
| Immigrants | Serbia | 97.4 /100 | #56 | Exceptional 5.1% |
| Immigrants | China | 97.2 /100 | #57 | Exceptional 5.1% |
| Asians | 97.2 /100 | #58 | Exceptional 5.1% |
| Swedes | 97.1 /100 | #59 | Exceptional 5.1% |
| Immigrants | Somalia | 97.1 /100 | #60 | Exceptional 5.1% |
| Indians (Asian) | 97.0 /100 | #61 | Exceptional 5.1% |
| Immigrants | France | 97.0 /100 | #62 | Exceptional 5.1% |
| Belgians | 97.0 /100 | #63 | Exceptional 5.1% |
| Immigrants | Eastern Asia | 96.9 /100 | #64 | Exceptional 5.1% |
| Immigrants | Japan | 96.8 /100 | #65 | Exceptional 5.1% |
| Immigrants | Zimbabwe | 96.7 /100 | #66 | Exceptional 5.1% |
| Burmese | 96.5 /100 | #67 | Exceptional 5.1% |
| Jordanians | 96.5 /100 | #68 | Exceptional 5.1% |
Demographics Similar to Delaware by Unemployment Among Ages 30 to 34 years
In terms of unemployment among ages 30 to 34 years, the demographic groups most similar to Delaware are Cajun (6.7%, a difference of 0.19%), Kiowa (6.7%, a difference of 0.61%), Paiute (6.7%, a difference of 0.64%), Belizean (6.6%, a difference of 0.84%), and Bahamian (6.6%, a difference of 1.1%).
| Demographics | Rating | Rank | Unemployment Among Ages 30 to 34 years |
| Trinidadians and Tobagonians | 0.0 /100 | #295 | Tragic 6.5% |
| Immigrants | Jamaica | 0.0 /100 | #296 | Tragic 6.5% |
| Creek | 0.0 /100 | #297 | Tragic 6.6% |
| Immigrants | Barbados | 0.0 /100 | #298 | Tragic 6.6% |
| Dutch West Indians | 0.0 /100 | #299 | Tragic 6.6% |
| Bahamians | 0.0 /100 | #300 | Tragic 6.6% |
| Belizeans | 0.0 /100 | #301 | Tragic 6.6% |
| Delaware | 0.0 /100 | #302 | Tragic 6.7% |
| Cajuns | 0.0 /100 | #303 | Tragic 6.7% |
| Kiowa | 0.0 /100 | #304 | Tragic 6.7% |
| Paiute | 0.0 /100 | #305 | Tragic 6.7% |
| Immigrants | Armenia | 0.0 /100 | #306 | Tragic 6.8% |
| Immigrants | Belize | 0.0 /100 | #307 | Tragic 6.9% |
| Immigrants | Azores | 0.0 /100 | #308 | Tragic 6.9% |
| Immigrants | Grenada | 0.0 /100 | #309 | Tragic 6.9% |