Barbadian vs Osage Unemployment Among Ages 30 to 34 years
COMPARE
Barbadian
Osage
Unemployment Among Ages 30 to 34 years
Unemployment Among Ages 30 to 34 years Comparison
Barbadians
Osage
6.5%
UNEMPLOYMENT AMONG AGES 30 TO 34 YEARS
0.0/ 100
METRIC RATING
294th/ 347
METRIC RANK
6.3%
UNEMPLOYMENT AMONG AGES 30 TO 34 YEARS
0.0/ 100
METRIC RATING
278th/ 347
METRIC RANK
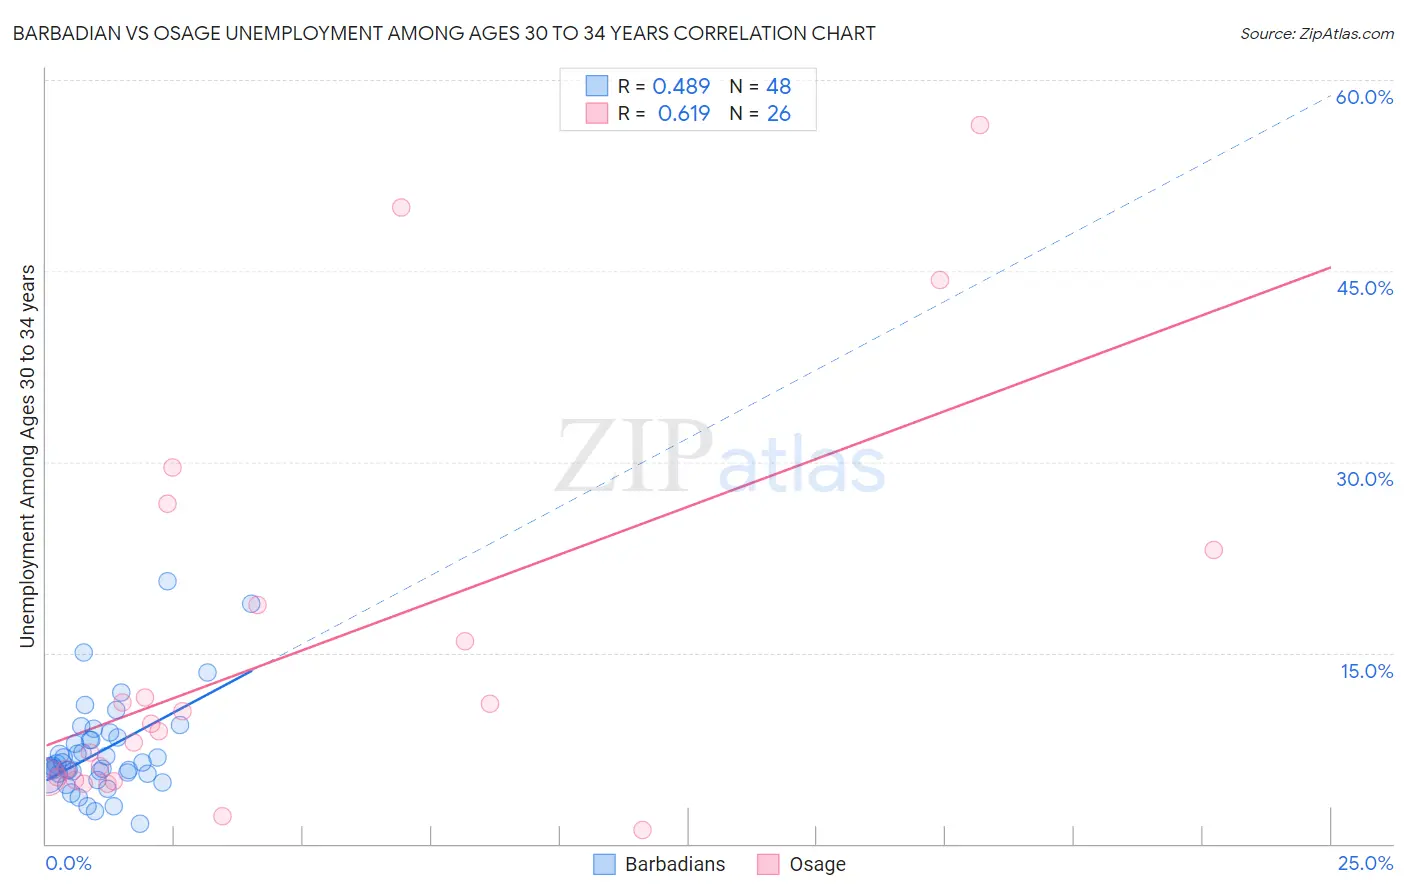
Barbadian vs Osage Unemployment Among Ages 30 to 34 years Correlation Chart
The statistical analysis conducted on geographies consisting of 139,164,017 people shows a moderate positive correlation between the proportion of Barbadians and unemployment rate among population between the ages 30 and 34 in the United States with a correlation coefficient (R) of 0.489 and weighted average of 6.5%. Similarly, the statistical analysis conducted on geographies consisting of 89,714,543 people shows a significant positive correlation between the proportion of Osage and unemployment rate among population between the ages 30 and 34 in the United States with a correlation coefficient (R) of 0.619 and weighted average of 6.3%, a difference of 3.0%.
Unemployment Among Ages 30 to 34 years Correlation Summary
| Measurement | Barbadian | Osage |
| Minimum | 1.6% | 1.1% |
| Maximum | 20.6% | 56.5% |
| Range | 19.0% | 55.4% |
| Mean | 7.2% | 14.9% |
| Median | 6.2% | 9.1% |
| Interquartile 25% (IQ1) | 5.5% | 5.2% |
| Interquartile 75% (IQ3) | 8.2% | 18.8% |
| Interquartile Range (IQR) | 2.7% | 13.6% |
| Standard Deviation (Sample) | 3.7% | 15.0% |
| Standard Deviation (Population) | 3.7% | 14.7% |
Demographics Similar to Barbadians and Osage by Unemployment Among Ages 30 to 34 years
In terms of unemployment among ages 30 to 34 years, the demographic groups most similar to Barbadians are Trinidadian and Tobagonian (6.5%, a difference of 0.24%), Immigrants from Jamaica (6.5%, a difference of 0.29%), West Indian (6.5%, a difference of 0.43%), Vietnamese (6.5%, a difference of 0.50%), and Jamaican (6.5%, a difference of 0.77%). Similarly, the demographic groups most similar to Osage are Immigrants from Ecuador (6.3%, a difference of 0.080%), Cree (6.4%, a difference of 0.48%), Cherokee (6.4%, a difference of 0.52%), Pennsylvania German (6.3%, a difference of 0.82%), and Immigrants from Caribbean (6.4%, a difference of 0.84%).
| Demographics | Rating | Rank | Unemployment Among Ages 30 to 34 years |
| Pennsylvania Germans | 0.0 /100 | #276 | Tragic 6.3% |
| Immigrants | Ecuador | 0.0 /100 | #277 | Tragic 6.3% |
| Osage | 0.0 /100 | #278 | Tragic 6.3% |
| Cree | 0.0 /100 | #279 | Tragic 6.4% |
| Cherokee | 0.0 /100 | #280 | Tragic 6.4% |
| Immigrants | Caribbean | 0.0 /100 | #281 | Tragic 6.4% |
| Africans | 0.0 /100 | #282 | Tragic 6.4% |
| Hispanics or Latinos | 0.0 /100 | #283 | Tragic 6.4% |
| Immigrants | Bangladesh | 0.0 /100 | #284 | Tragic 6.4% |
| Choctaw | 0.0 /100 | #285 | Tragic 6.4% |
| Central American Indians | 0.0 /100 | #286 | Tragic 6.4% |
| Immigrants | West Indies | 0.0 /100 | #287 | Tragic 6.4% |
| Senegalese | 0.0 /100 | #288 | Tragic 6.4% |
| Menominee | 0.0 /100 | #289 | Tragic 6.4% |
| Immigrants | Trinidad and Tobago | 0.0 /100 | #290 | Tragic 6.5% |
| Jamaicans | 0.0 /100 | #291 | Tragic 6.5% |
| Vietnamese | 0.0 /100 | #292 | Tragic 6.5% |
| West Indians | 0.0 /100 | #293 | Tragic 6.5% |
| Barbadians | 0.0 /100 | #294 | Tragic 6.5% |
| Trinidadians and Tobagonians | 0.0 /100 | #295 | Tragic 6.5% |
| Immigrants | Jamaica | 0.0 /100 | #296 | Tragic 6.5% |