Indian (Asian) vs Osage Female Poverty Among 18-24 Year Olds
COMPARE
Indian (Asian)
Osage
Female Poverty Among 18-24 Year Olds
Female Poverty Among 18-24 Year Olds Comparison
Indians (Asian)
Osage
19.6%
FEMALE POVERTY AMONG 18-24 YEAR OLDS
88.3/ 100
METRIC RATING
139th/ 347
METRIC RANK
24.5%
FEMALE POVERTY AMONG 18-24 YEAR OLDS
0.0/ 100
METRIC RATING
317th/ 347
METRIC RANK
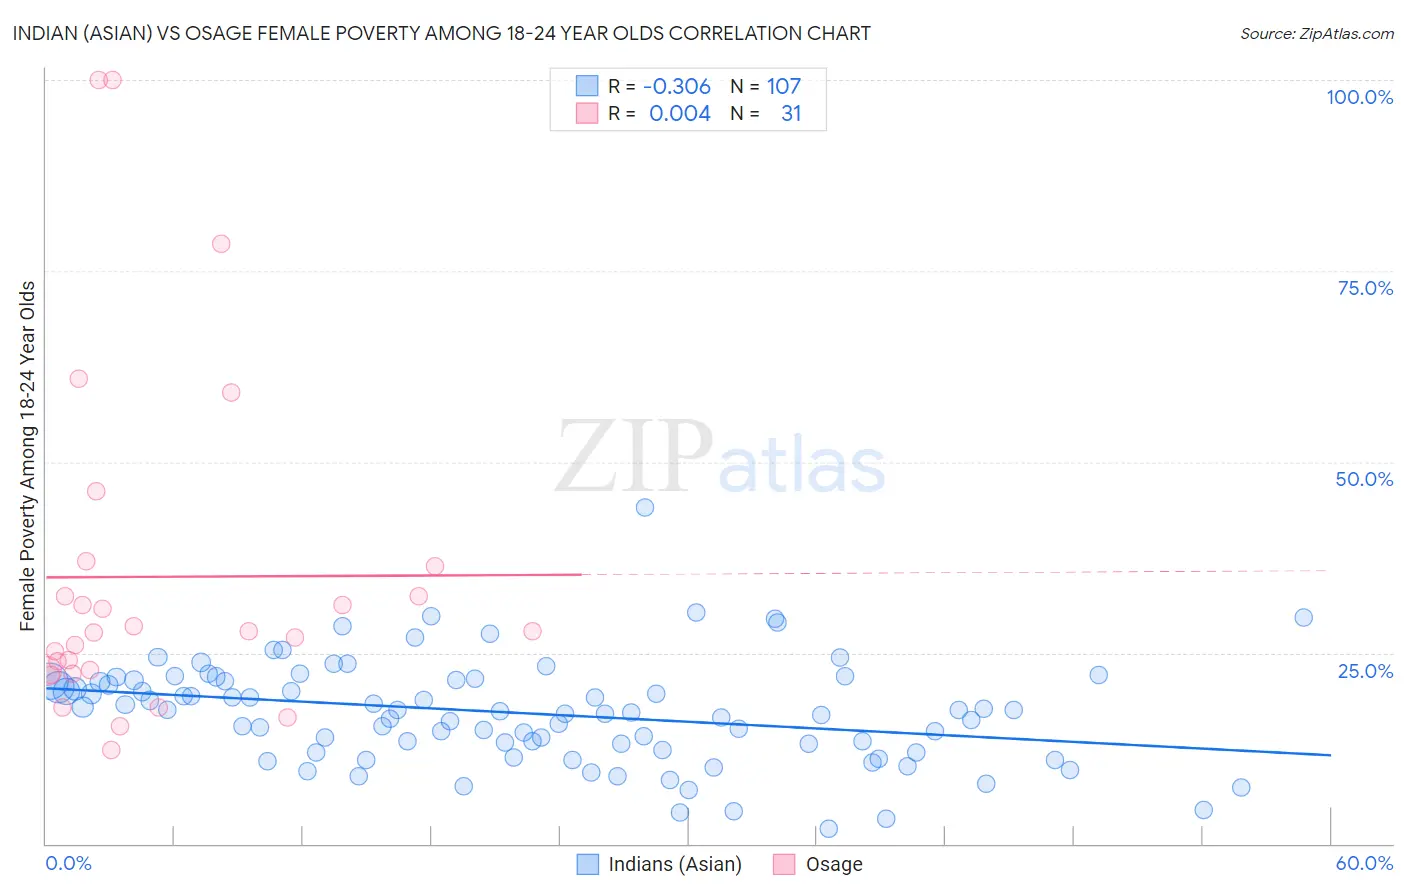
Indian (Asian) vs Osage Female Poverty Among 18-24 Year Olds Correlation Chart
The statistical analysis conducted on geographies consisting of 476,846,332 people shows a mild negative correlation between the proportion of Indians (Asian) and poverty level among females between the ages 18 and 24 in the United States with a correlation coefficient (R) of -0.306 and weighted average of 19.6%. Similarly, the statistical analysis conducted on geographies consisting of 91,241,953 people shows no correlation between the proportion of Osage and poverty level among females between the ages 18 and 24 in the United States with a correlation coefficient (R) of 0.004 and weighted average of 24.5%, a difference of 24.8%.
Female Poverty Among 18-24 Year Olds Correlation Summary
| Measurement | Indian (Asian) | Osage |
| Minimum | 2.0% | 12.3% |
| Maximum | 44.1% | 100.0% |
| Range | 42.1% | 87.7% |
| Mean | 17.1% | 35.0% |
| Median | 17.4% | 27.8% |
| Interquartile 25% (IQ1) | 12.3% | 22.6% |
| Interquartile 75% (IQ3) | 21.4% | 36.4% |
| Interquartile Range (IQR) | 9.1% | 13.7% |
| Standard Deviation (Sample) | 6.8% | 22.3% |
| Standard Deviation (Population) | 6.8% | 21.9% |
Similar Demographics by Female Poverty Among 18-24 Year Olds
Demographics Similar to Indians (Asian) by Female Poverty Among 18-24 Year Olds
In terms of female poverty among 18-24 year olds, the demographic groups most similar to Indians (Asian) are Immigrants from Morocco (19.6%, a difference of 0.20%), Immigrants from Trinidad and Tobago (19.7%, a difference of 0.30%), Pennsylvania German (19.7%, a difference of 0.31%), Austrian (19.5%, a difference of 0.32%), and Panamanian (19.7%, a difference of 0.41%).
| Demographics | Rating | Rank | Female Poverty Among 18-24 Year Olds |
| Jamaicans | 92.1 /100 | #132 | Exceptional 19.5% |
| Turks | 92.1 /100 | #133 | Exceptional 19.5% |
| Immigrants | North America | 92.1 /100 | #134 | Exceptional 19.5% |
| Soviet Union | 92.0 /100 | #135 | Exceptional 19.5% |
| Russians | 91.5 /100 | #136 | Exceptional 19.5% |
| Austrians | 90.7 /100 | #137 | Exceptional 19.5% |
| Immigrants | Morocco | 89.9 /100 | #138 | Excellent 19.6% |
| Indians (Asian) | 88.3 /100 | #139 | Excellent 19.6% |
| Immigrants | Trinidad and Tobago | 85.6 /100 | #140 | Excellent 19.7% |
| Pennsylvania Germans | 85.5 /100 | #141 | Excellent 19.7% |
| Panamanians | 84.6 /100 | #142 | Excellent 19.7% |
| Slavs | 84.4 /100 | #143 | Excellent 19.7% |
| Immigrants | Northern Africa | 84.1 /100 | #144 | Excellent 19.7% |
| Canadians | 83.8 /100 | #145 | Excellent 19.7% |
| Immigrants | Bosnia and Herzegovina | 83.6 /100 | #146 | Excellent 19.7% |
Demographics Similar to Osage by Female Poverty Among 18-24 Year Olds
In terms of female poverty among 18-24 year olds, the demographic groups most similar to Osage are Chickasaw (24.5%, a difference of 0.090%), Dutch West Indian (24.5%, a difference of 0.18%), Alsatian (24.4%, a difference of 0.29%), Immigrants from Congo (24.6%, a difference of 0.48%), and Black/African American (24.3%, a difference of 0.60%).
| Demographics | Rating | Rank | Female Poverty Among 18-24 Year Olds |
| Comanche | 0.0 /100 | #310 | Tragic 23.6% |
| Potawatomi | 0.0 /100 | #311 | Tragic 23.7% |
| Yuman | 0.0 /100 | #312 | Tragic 24.0% |
| Creek | 0.0 /100 | #313 | Tragic 24.2% |
| Choctaw | 0.0 /100 | #314 | Tragic 24.3% |
| Blacks/African Americans | 0.0 /100 | #315 | Tragic 24.3% |
| Alsatians | 0.0 /100 | #316 | Tragic 24.4% |
| Osage | 0.0 /100 | #317 | Tragic 24.5% |
| Chickasaw | 0.0 /100 | #318 | Tragic 24.5% |
| Dutch West Indians | 0.0 /100 | #319 | Tragic 24.5% |
| Immigrants | Congo | 0.0 /100 | #320 | Tragic 24.6% |
| Immigrants | Zaire | 0.0 /100 | #321 | Tragic 25.1% |
| Somalis | 0.0 /100 | #322 | Tragic 25.1% |
| Arapaho | 0.0 /100 | #323 | Tragic 25.2% |
| German Russians | 0.0 /100 | #324 | Tragic 25.2% |