Immigrants from Philippines vs Puerto Rican Unemployment Among Women with Children Ages 6 to 17 years
COMPARE
Immigrants from Philippines
Puerto Rican
Unemployment Among Women with Children Ages 6 to 17 years
Unemployment Among Women with Children Ages 6 to 17 years Comparison
Immigrants from Philippines
Puerto Ricans
8.2%
UNEMPLOYMENT AMONG WOMEN WITH CHILDREN AGES 6 TO 17 YEARS
100.0/ 100
METRIC RATING
59th/ 347
METRIC RANK
13.9%
UNEMPLOYMENT AMONG WOMEN WITH CHILDREN AGES 6 TO 17 YEARS
0.0/ 100
METRIC RATING
340th/ 347
METRIC RANK
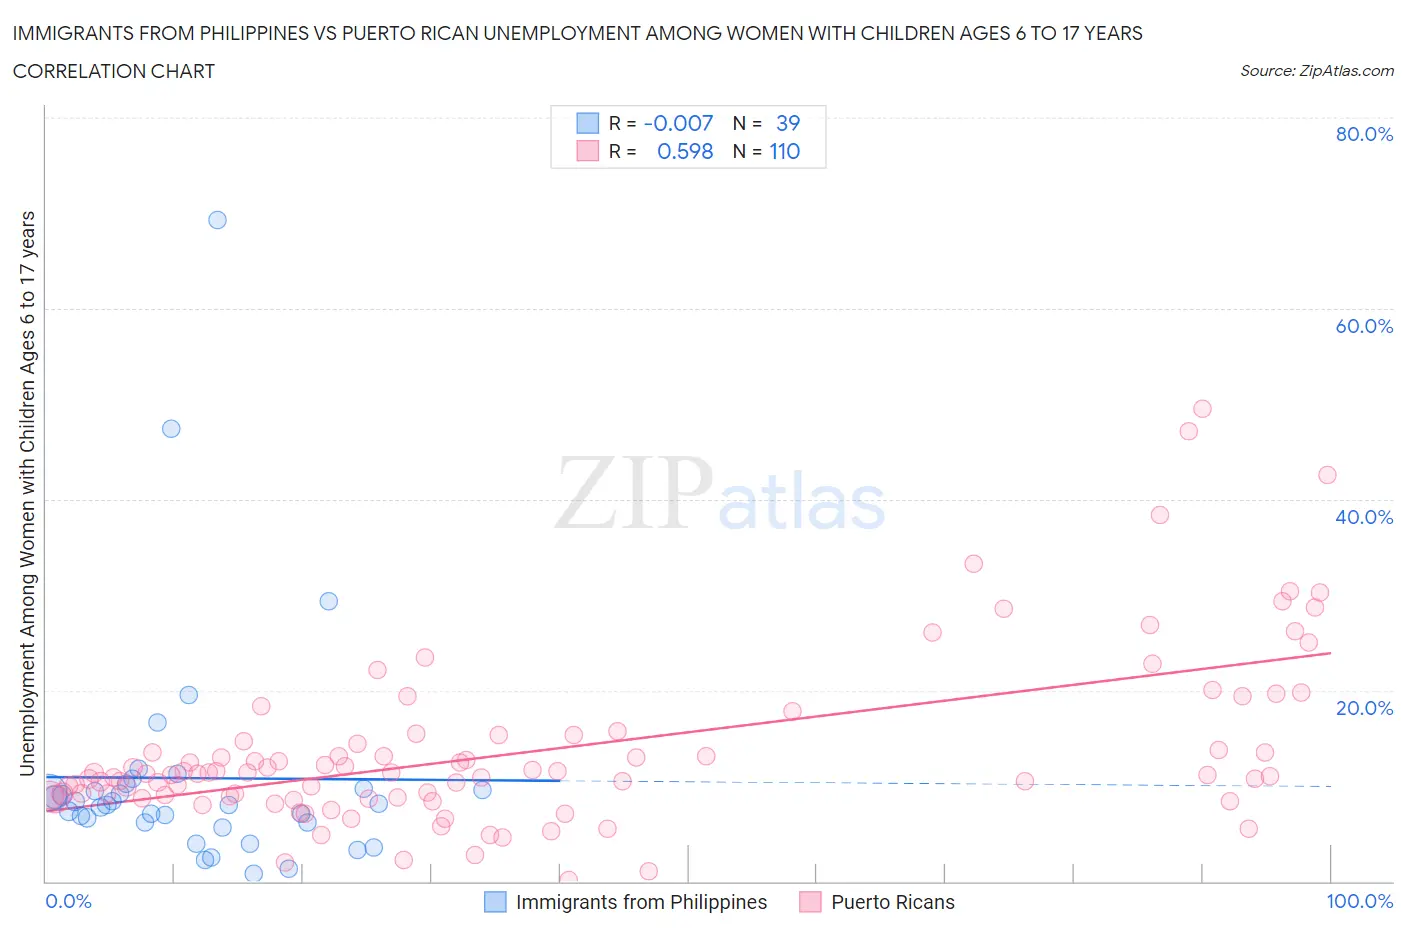
Immigrants from Philippines vs Puerto Rican Unemployment Among Women with Children Ages 6 to 17 years Correlation Chart
The statistical analysis conducted on geographies consisting of 325,343,715 people shows no correlation between the proportion of Immigrants from Philippines and unemployment rate among women with children between the ages 6 and 17 in the United States with a correlation coefficient (R) of -0.007 and weighted average of 8.2%. Similarly, the statistical analysis conducted on geographies consisting of 349,926,065 people shows a substantial positive correlation between the proportion of Puerto Ricans and unemployment rate among women with children between the ages 6 and 17 in the United States with a correlation coefficient (R) of 0.598 and weighted average of 13.9%, a difference of 69.4%.
Unemployment Among Women with Children Ages 6 to 17 years Correlation Summary
| Measurement | Immigrants from Philippines | Puerto Rican |
| Minimum | 0.80% | 0.10% |
| Maximum | 69.3% | 49.5% |
| Range | 68.5% | 49.4% |
| Mean | 10.8% | 13.7% |
| Median | 8.0% | 11.3% |
| Interquartile 25% (IQ1) | 6.1% | 9.0% |
| Interquartile 75% (IQ3) | 9.7% | 15.3% |
| Interquartile Range (IQR) | 3.6% | 6.3% |
| Standard Deviation (Sample) | 12.5% | 8.9% |
| Standard Deviation (Population) | 12.4% | 8.9% |
Similar Demographics by Unemployment Among Women with Children Ages 6 to 17 years
Demographics Similar to Immigrants from Philippines by Unemployment Among Women with Children Ages 6 to 17 years
In terms of unemployment among women with children ages 6 to 17 years, the demographic groups most similar to Immigrants from Philippines are Basque (8.2%, a difference of 0.0%), Immigrants from Malaysia (8.2%, a difference of 0.060%), Korean (8.2%, a difference of 0.19%), Spanish American Indian (8.2%, a difference of 0.22%), and Immigrants from Laos (8.2%, a difference of 0.26%).
| Demographics | Rating | Rank | Unemployment Among Women with Children Ages 6 to 17 years |
| Immigrants | Iraq | 100.0 /100 | #52 | Exceptional 8.1% |
| Danes | 100.0 /100 | #53 | Exceptional 8.1% |
| Immigrants | Armenia | 100.0 /100 | #54 | Exceptional 8.2% |
| Immigrants | Japan | 100.0 /100 | #55 | Exceptional 8.2% |
| Immigrants | Bosnia and Herzegovina | 100.0 /100 | #56 | Exceptional 8.2% |
| Immigrants | Laos | 100.0 /100 | #57 | Exceptional 8.2% |
| Immigrants | Malaysia | 100.0 /100 | #58 | Exceptional 8.2% |
| Immigrants | Philippines | 100.0 /100 | #59 | Exceptional 8.2% |
| Basques | 100.0 /100 | #60 | Exceptional 8.2% |
| Koreans | 100.0 /100 | #61 | Exceptional 8.2% |
| Spanish American Indians | 100.0 /100 | #62 | Exceptional 8.2% |
| Immigrants | South Eastern Asia | 99.9 /100 | #63 | Exceptional 8.2% |
| Immigrants | Kuwait | 99.9 /100 | #64 | Exceptional 8.3% |
| Immigrants | Albania | 99.9 /100 | #65 | Exceptional 8.3% |
| Luxembourgers | 99.9 /100 | #66 | Exceptional 8.3% |
Demographics Similar to Puerto Ricans by Unemployment Among Women with Children Ages 6 to 17 years
In terms of unemployment among women with children ages 6 to 17 years, the demographic groups most similar to Puerto Ricans are Navajo (14.2%, a difference of 2.1%), Sioux (13.2%, a difference of 4.8%), Yuman (14.8%, a difference of 6.8%), Inupiat (14.9%, a difference of 7.1%), and Hopi (12.9%, a difference of 7.5%).
| Demographics | Rating | Rank | Unemployment Among Women with Children Ages 6 to 17 years |
| Natives/Alaskans | 0.0 /100 | #333 | Tragic 11.5% |
| Ugandans | 0.0 /100 | #334 | Tragic 12.0% |
| Colville | 0.0 /100 | #335 | Tragic 12.3% |
| Houma | 0.0 /100 | #336 | Tragic 12.5% |
| Immigrants | Yemen | 0.0 /100 | #337 | Tragic 12.7% |
| Hopi | 0.0 /100 | #338 | Tragic 12.9% |
| Sioux | 0.0 /100 | #339 | Tragic 13.2% |
| Puerto Ricans | 0.0 /100 | #340 | Tragic 13.9% |
| Navajo | 0.0 /100 | #341 | Tragic 14.2% |
| Yuman | 0.0 /100 | #342 | Tragic 14.8% |
| Inupiat | 0.0 /100 | #343 | Tragic 14.9% |
| Cheyenne | 0.0 /100 | #344 | Tragic 16.4% |
| Arapaho | 0.0 /100 | #345 | Tragic 16.8% |
| Yup'ik | 0.0 /100 | #346 | Tragic 18.6% |
| Pima | 0.0 /100 | #347 | Tragic 18.9% |