Immigrants from Philippines vs Puerto Rican 5th Grade
COMPARE
Immigrants from Philippines
Puerto Rican
5th Grade
5th Grade Comparison
Immigrants from Philippines
Puerto Ricans
96.6%
5TH GRADE
0.1/ 100
METRIC RATING
279th/ 347
METRIC RANK
96.1%
5TH GRADE
0.0/ 100
METRIC RATING
303rd/ 347
METRIC RANK
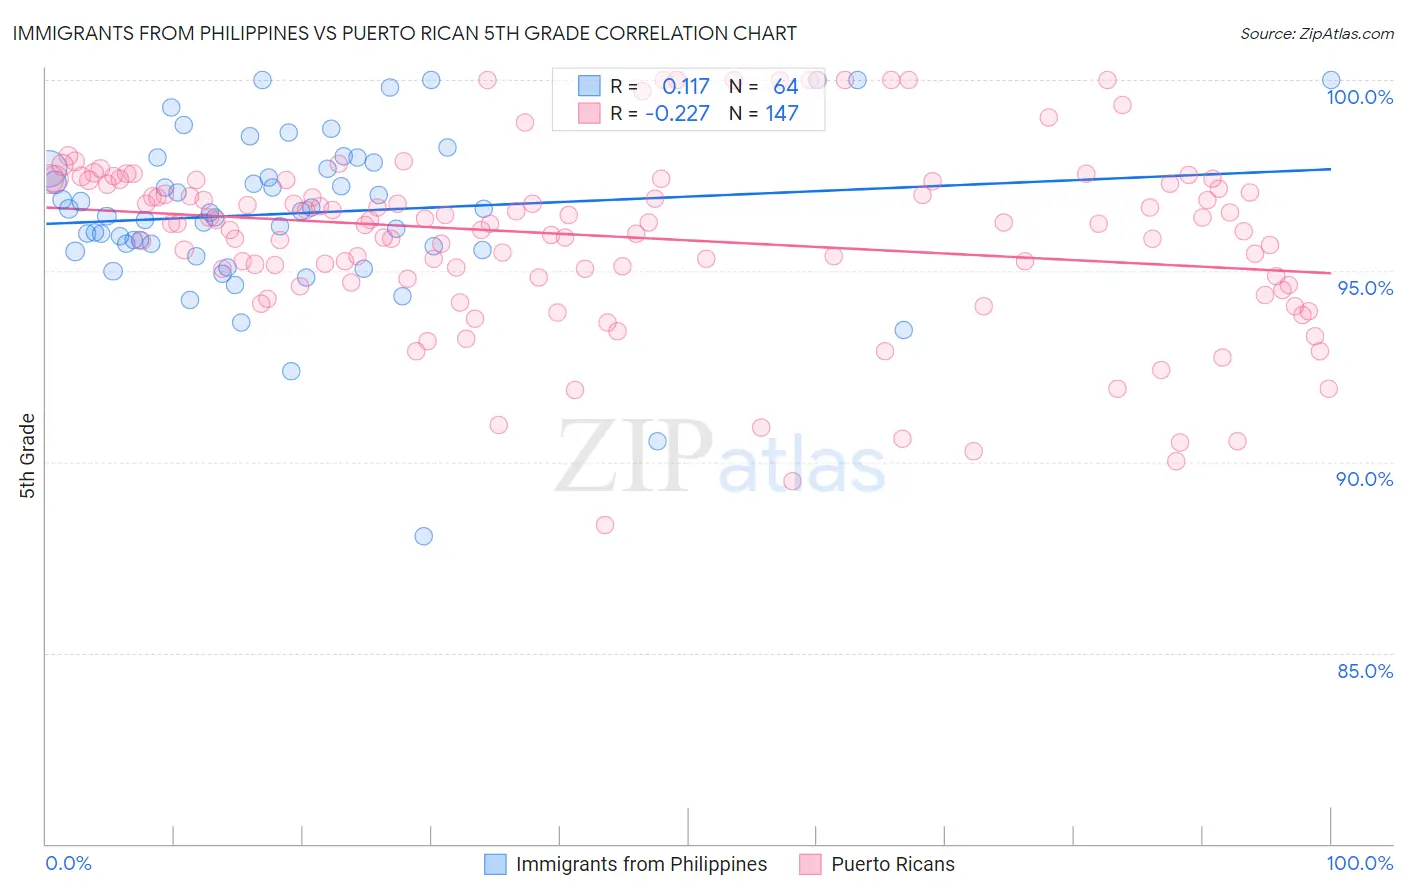
Immigrants from Philippines vs Puerto Rican 5th Grade Correlation Chart
The statistical analysis conducted on geographies consisting of 471,303,531 people shows a poor positive correlation between the proportion of Immigrants from Philippines and percentage of population with at least 5th grade education in the United States with a correlation coefficient (R) of 0.117 and weighted average of 96.6%. Similarly, the statistical analysis conducted on geographies consisting of 528,320,438 people shows a weak negative correlation between the proportion of Puerto Ricans and percentage of population with at least 5th grade education in the United States with a correlation coefficient (R) of -0.227 and weighted average of 96.1%, a difference of 0.56%.
5th Grade Correlation Summary
| Measurement | Immigrants from Philippines | Puerto Rican |
| Minimum | 88.1% | 88.4% |
| Maximum | 100.0% | 100.0% |
| Range | 11.9% | 11.6% |
| Mean | 96.5% | 95.9% |
| Median | 96.5% | 96.2% |
| Interquartile 25% (IQ1) | 95.6% | 94.8% |
| Interquartile 75% (IQ3) | 97.8% | 97.4% |
| Interquartile Range (IQR) | 2.2% | 2.6% |
| Standard Deviation (Sample) | 2.1% | 2.4% |
| Standard Deviation (Population) | 2.1% | 2.4% |
Similar Demographics by 5th Grade
Demographics Similar to Immigrants from Philippines by 5th Grade
In terms of 5th grade, the demographic groups most similar to Immigrants from Philippines are Immigrants from Ghana (96.6%, a difference of 0.010%), Immigrants from Western Africa (96.6%, a difference of 0.010%), Houma (96.6%, a difference of 0.010%), Barbadian (96.6%, a difference of 0.010%), and Fijian (96.6%, a difference of 0.010%).
| Demographics | Rating | Rank | 5th Grade |
| Trinidadians and Tobagonians | 0.1 /100 | #272 | Tragic 96.7% |
| Yaqui | 0.1 /100 | #273 | Tragic 96.7% |
| Immigrants | Cameroon | 0.1 /100 | #274 | Tragic 96.7% |
| Immigrants | Peru | 0.1 /100 | #275 | Tragic 96.6% |
| Cubans | 0.1 /100 | #276 | Tragic 96.6% |
| Immigrants | Bolivia | 0.1 /100 | #277 | Tragic 96.6% |
| Immigrants | Ghana | 0.1 /100 | #278 | Tragic 96.6% |
| Immigrants | Philippines | 0.1 /100 | #279 | Tragic 96.6% |
| Immigrants | Western Africa | 0.1 /100 | #280 | Tragic 96.6% |
| Houma | 0.1 /100 | #281 | Tragic 96.6% |
| Barbadians | 0.1 /100 | #282 | Tragic 96.6% |
| Fijians | 0.1 /100 | #283 | Tragic 96.6% |
| Immigrants | Trinidad and Tobago | 0.1 /100 | #284 | Tragic 96.6% |
| Immigrants | St. Vincent and the Grenadines | 0.1 /100 | #285 | Tragic 96.6% |
| Immigrants | Thailand | 0.1 /100 | #286 | Tragic 96.6% |
Demographics Similar to Puerto Ricans by 5th Grade
In terms of 5th grade, the demographic groups most similar to Puerto Ricans are Guyanese (96.1%, a difference of 0.010%), Immigrants from Cuba (96.1%, a difference of 0.020%), Immigrants from Burma/Myanmar (96.1%, a difference of 0.030%), Sri Lankan (96.1%, a difference of 0.040%), and Immigrants from Laos (96.0%, a difference of 0.040%).
| Demographics | Rating | Rank | 5th Grade |
| Immigrants | South Eastern Asia | 0.0 /100 | #296 | Tragic 96.3% |
| Haitians | 0.0 /100 | #297 | Tragic 96.3% |
| Immigrants | Dominica | 0.0 /100 | #298 | Tragic 96.2% |
| Immigrants | Immigrants | 0.0 /100 | #299 | Tragic 96.2% |
| Sri Lankans | 0.0 /100 | #300 | Tragic 96.1% |
| Immigrants | Cuba | 0.0 /100 | #301 | Tragic 96.1% |
| Guyanese | 0.0 /100 | #302 | Tragic 96.1% |
| Puerto Ricans | 0.0 /100 | #303 | Tragic 96.1% |
| Immigrants | Burma/Myanmar | 0.0 /100 | #304 | Tragic 96.1% |
| Immigrants | Laos | 0.0 /100 | #305 | Tragic 96.0% |
| Immigrants | Haiti | 0.0 /100 | #306 | Tragic 96.0% |
| Immigrants | Caribbean | 0.0 /100 | #307 | Tragic 96.0% |
| Ecuadorians | 0.0 /100 | #308 | Tragic 96.0% |
| Immigrants | Guyana | 0.0 /100 | #309 | Tragic 96.0% |
| Indonesians | 0.0 /100 | #310 | Tragic 96.0% |