Immigrants from Middle Africa vs West Indian Disability Age 65 to 74
COMPARE
Immigrants from Middle Africa
West Indian
Disability Age 65 to 74
Disability Age 65 to 74 Comparison
Immigrants from Middle Africa
West Indians
24.1%
DISABILITY AGE 65 TO 74
8.9/ 100
METRIC RATING
223rd/ 347
METRIC RANK
24.5%
DISABILITY AGE 65 TO 74
3.4/ 100
METRIC RATING
237th/ 347
METRIC RANK
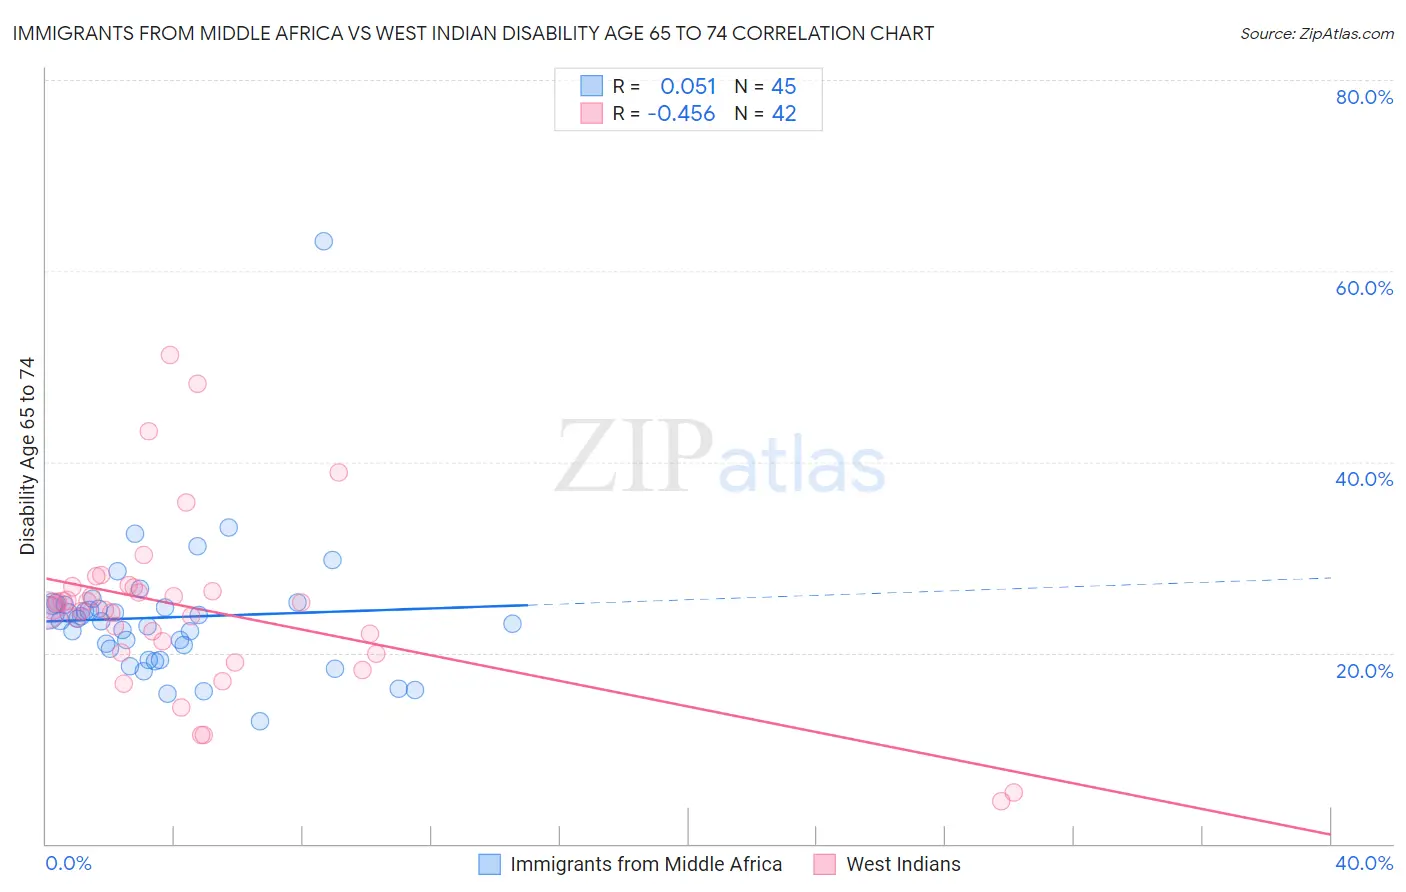
Immigrants from Middle Africa vs West Indian Disability Age 65 to 74 Correlation Chart
The statistical analysis conducted on geographies consisting of 202,480,868 people shows a slight positive correlation between the proportion of Immigrants from Middle Africa and percentage of population with a disability between the ages 65 and 75 in the United States with a correlation coefficient (R) of 0.051 and weighted average of 24.1%. Similarly, the statistical analysis conducted on geographies consisting of 253,647,264 people shows a moderate negative correlation between the proportion of West Indians and percentage of population with a disability between the ages 65 and 75 in the United States with a correlation coefficient (R) of -0.456 and weighted average of 24.5%, a difference of 1.4%.
Disability Age 65 to 74 Correlation Summary
| Measurement | Immigrants from Middle Africa | West Indian |
| Minimum | 12.9% | 4.5% |
| Maximum | 63.1% | 51.2% |
| Range | 50.2% | 46.7% |
| Mean | 23.7% | 24.6% |
| Median | 23.4% | 24.6% |
| Interquartile 25% (IQ1) | 19.9% | 20.1% |
| Interquartile 75% (IQ3) | 25.0% | 26.8% |
| Interquartile Range (IQR) | 5.2% | 6.7% |
| Standard Deviation (Sample) | 7.4% | 9.3% |
| Standard Deviation (Population) | 7.3% | 9.1% |
Demographics Similar to Immigrants from Middle Africa and West Indians by Disability Age 65 to 74
In terms of disability age 65 to 74, the demographic groups most similar to Immigrants from Middle Africa are Immigrants from Panama (24.1%, a difference of 0.050%), Native Hawaiian (24.1%, a difference of 0.070%), Bermudan (24.2%, a difference of 0.13%), Immigrants from Nicaragua (24.1%, a difference of 0.14%), and Iraqi (24.2%, a difference of 0.14%). Similarly, the demographic groups most similar to West Indians are German Russian (24.4%, a difference of 0.10%), Scotch-Irish (24.4%, a difference of 0.14%), Immigrants from Ghana (24.5%, a difference of 0.17%), Panamanian (24.4%, a difference of 0.29%), and Immigrants from Caribbean (24.6%, a difference of 0.39%).
| Demographics | Rating | Rank | Disability Age 65 to 74 |
| Ghanaians | 10.4 /100 | #220 | Poor 24.1% |
| Immigrants | Nicaragua | 9.8 /100 | #221 | Tragic 24.1% |
| Native Hawaiians | 9.3 /100 | #222 | Tragic 24.1% |
| Immigrants | Middle Africa | 8.9 /100 | #223 | Tragic 24.1% |
| Immigrants | Panama | 8.6 /100 | #224 | Tragic 24.1% |
| Bermudans | 8.2 /100 | #225 | Tragic 24.2% |
| Iraqis | 8.1 /100 | #226 | Tragic 24.2% |
| Nigerians | 7.8 /100 | #227 | Tragic 24.2% |
| Whites/Caucasians | 6.6 /100 | #228 | Tragic 24.2% |
| Celtics | 6.4 /100 | #229 | Tragic 24.2% |
| Barbadians | 6.0 /100 | #230 | Tragic 24.3% |
| Immigrants | Thailand | 5.2 /100 | #231 | Tragic 24.3% |
| Immigrants | Zaire | 5.0 /100 | #232 | Tragic 24.3% |
| Bahamians | 4.5 /100 | #233 | Tragic 24.4% |
| Panamanians | 4.2 /100 | #234 | Tragic 24.4% |
| Scotch-Irish | 3.8 /100 | #235 | Tragic 24.4% |
| German Russians | 3.7 /100 | #236 | Tragic 24.4% |
| West Indians | 3.4 /100 | #237 | Tragic 24.5% |
| Immigrants | Ghana | 3.0 /100 | #238 | Tragic 24.5% |
| Immigrants | Caribbean | 2.6 /100 | #239 | Tragic 24.6% |
| Spaniards | 2.4 /100 | #240 | Tragic 24.6% |