Immigrants from Burma/Myanmar vs Nonimmigrants Unemployment Among Youth under 25 years
COMPARE
Immigrants from Burma/Myanmar
Nonimmigrants
Unemployment Among Youth under 25 years
Unemployment Among Youth under 25 years Comparison
Immigrants from Burma/Myanmar
Nonimmigrants
10.6%
UNEMPLOYMENT AMONG YOUTH UNDER 25 YEARS
100.0/ 100
METRIC RATING
19th/ 347
METRIC RANK
11.9%
UNEMPLOYMENT AMONG YOUTH UNDER 25 YEARS
6.2/ 100
METRIC RATING
219th/ 347
METRIC RANK
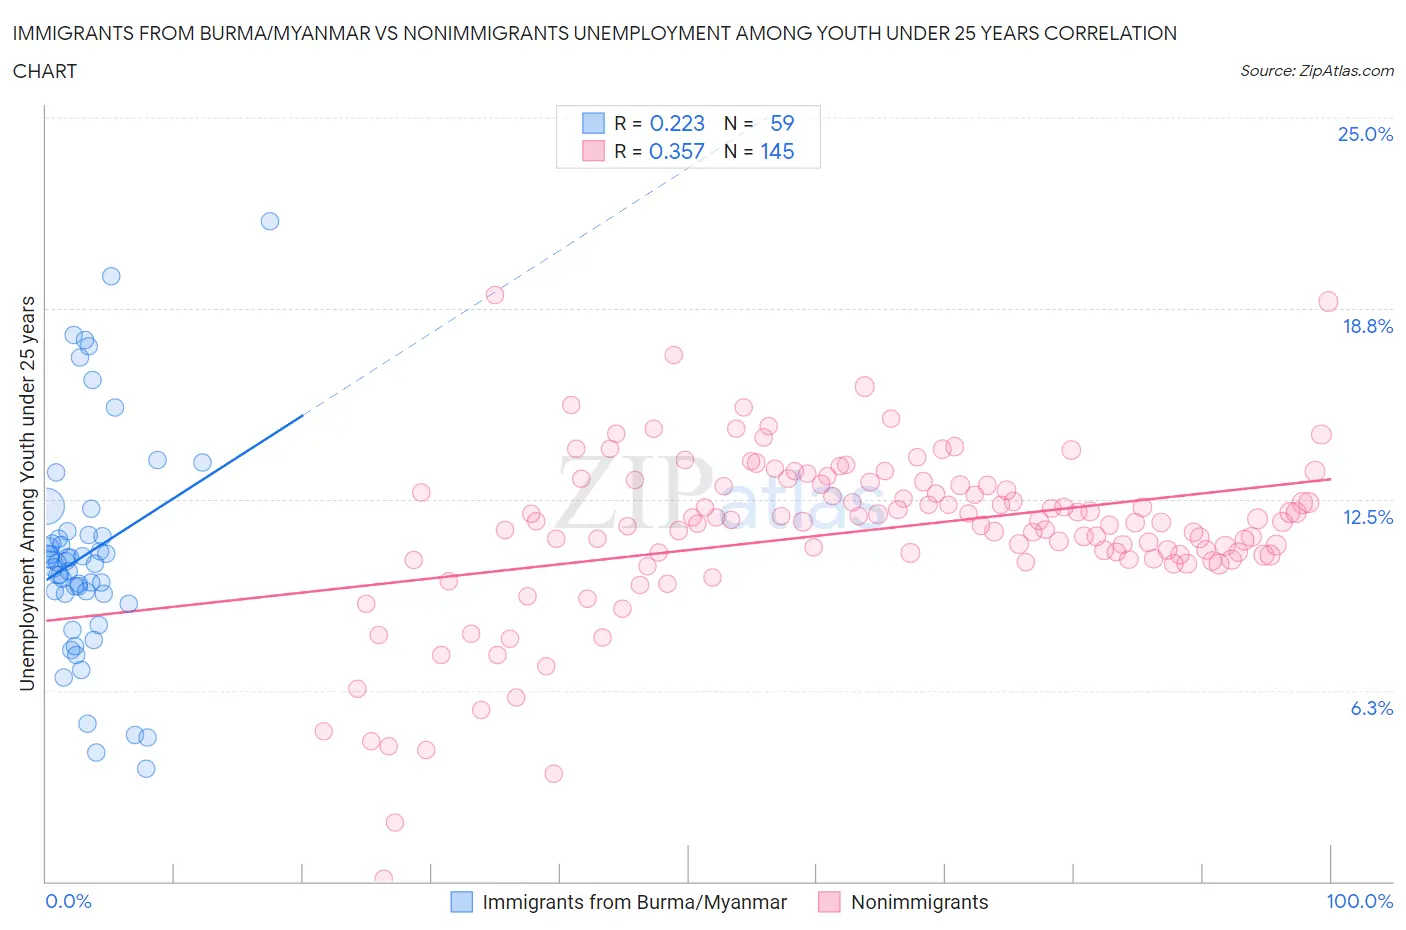
Immigrants from Burma/Myanmar vs Nonimmigrants Unemployment Among Youth under 25 years Correlation Chart
The statistical analysis conducted on geographies consisting of 171,764,683 people shows a weak positive correlation between the proportion of Immigrants from Burma/Myanmar and unemployment rate among youth under the age of 25 in the United States with a correlation coefficient (R) of 0.223 and weighted average of 10.6%. Similarly, the statistical analysis conducted on geographies consisting of 555,778,724 people shows a mild positive correlation between the proportion of Nonimmigrants and unemployment rate among youth under the age of 25 in the United States with a correlation coefficient (R) of 0.357 and weighted average of 11.9%, a difference of 12.6%.
Unemployment Among Youth under 25 years Correlation Summary
| Measurement | Immigrants from Burma/Myanmar | Nonimmigrants |
| Minimum | 3.7% | 0.10% |
| Maximum | 21.6% | 19.2% |
| Range | 17.9% | 19.1% |
| Mean | 10.7% | 11.5% |
| Median | 10.4% | 11.8% |
| Interquartile 25% (IQ1) | 9.4% | 10.7% |
| Interquartile 75% (IQ3) | 11.3% | 13.0% |
| Interquartile Range (IQR) | 1.9% | 2.3% |
| Standard Deviation (Sample) | 3.6% | 2.8% |
| Standard Deviation (Population) | 3.6% | 2.8% |
Similar Demographics by Unemployment Among Youth under 25 years
Demographics Similar to Immigrants from Burma/Myanmar by Unemployment Among Youth under 25 years
In terms of unemployment among youth under 25 years, the demographic groups most similar to Immigrants from Burma/Myanmar are Swiss (10.6%, a difference of 0.010%), Dutch (10.6%, a difference of 0.020%), Menominee (10.6%, a difference of 0.17%), Sudanese (10.6%, a difference of 0.22%), and Venezuelan (10.6%, a difference of 0.22%).
| Demographics | Rating | Rank | Unemployment Among Youth under 25 years |
| Immigrants | Sudan | 100.0 /100 | #12 | Exceptional 10.5% |
| Indonesians | 100.0 /100 | #13 | Exceptional 10.6% |
| Cubans | 100.0 /100 | #14 | Exceptional 10.6% |
| Sudanese | 100.0 /100 | #15 | Exceptional 10.6% |
| Venezuelans | 100.0 /100 | #16 | Exceptional 10.6% |
| Menominee | 100.0 /100 | #17 | Exceptional 10.6% |
| Swiss | 100.0 /100 | #18 | Exceptional 10.6% |
| Immigrants | Burma/Myanmar | 100.0 /100 | #19 | Exceptional 10.6% |
| Dutch | 100.0 /100 | #20 | Exceptional 10.6% |
| Pennsylvania Germans | 100.0 /100 | #21 | Exceptional 10.6% |
| Belgians | 100.0 /100 | #22 | Exceptional 10.6% |
| Immigrants | Bosnia and Herzegovina | 100.0 /100 | #23 | Exceptional 10.6% |
| Finns | 100.0 /100 | #24 | Exceptional 10.7% |
| Immigrants | North Macedonia | 100.0 /100 | #25 | Exceptional 10.7% |
| Immigrants | India | 100.0 /100 | #26 | Exceptional 10.7% |
Demographics Similar to Nonimmigrants by Unemployment Among Youth under 25 years
In terms of unemployment among youth under 25 years, the demographic groups most similar to Nonimmigrants are Alsatian (11.9%, a difference of 0.020%), Immigrants from Middle Africa (11.9%, a difference of 0.11%), Yaqui (11.9%, a difference of 0.12%), Guamanian/Chamorro (11.9%, a difference of 0.13%), and Samoan (11.9%, a difference of 0.19%).
| Demographics | Rating | Rank | Unemployment Among Youth under 25 years |
| Colombians | 9.1 /100 | #212 | Tragic 11.9% |
| South Americans | 8.5 /100 | #213 | Tragic 11.9% |
| Costa Ricans | 8.2 /100 | #214 | Tragic 11.9% |
| Samoans | 7.4 /100 | #215 | Tragic 11.9% |
| Guamanians/Chamorros | 7.0 /100 | #216 | Tragic 11.9% |
| Yaqui | 6.9 /100 | #217 | Tragic 11.9% |
| Immigrants | Middle Africa | 6.8 /100 | #218 | Tragic 11.9% |
| Immigrants | Nonimmigrants | 6.2 /100 | #219 | Tragic 11.9% |
| Alsatians | 6.1 /100 | #220 | Tragic 11.9% |
| Immigrants | Portugal | 4.9 /100 | #221 | Tragic 12.0% |
| Israelis | 4.1 /100 | #222 | Tragic 12.0% |
| Immigrants | Ireland | 3.5 /100 | #223 | Tragic 12.0% |
| Hawaiians | 3.5 /100 | #224 | Tragic 12.0% |
| Immigrants | Ukraine | 3.0 /100 | #225 | Tragic 12.0% |
| Immigrants | Israel | 2.6 /100 | #226 | Tragic 12.0% |