Immigrants from Burma/Myanmar vs Marshallese Unemployment Among Youth under 25 years
COMPARE
Immigrants from Burma/Myanmar
Marshallese
Unemployment Among Youth under 25 years
Unemployment Among Youth under 25 years Comparison
Immigrants from Burma/Myanmar
Marshallese
10.6%
UNEMPLOYMENT AMONG YOUTH UNDER 25 YEARS
100.0/ 100
METRIC RATING
19th/ 347
METRIC RANK
11.8%
UNEMPLOYMENT AMONG YOUTH UNDER 25 YEARS
15.8/ 100
METRIC RATING
202nd/ 347
METRIC RANK
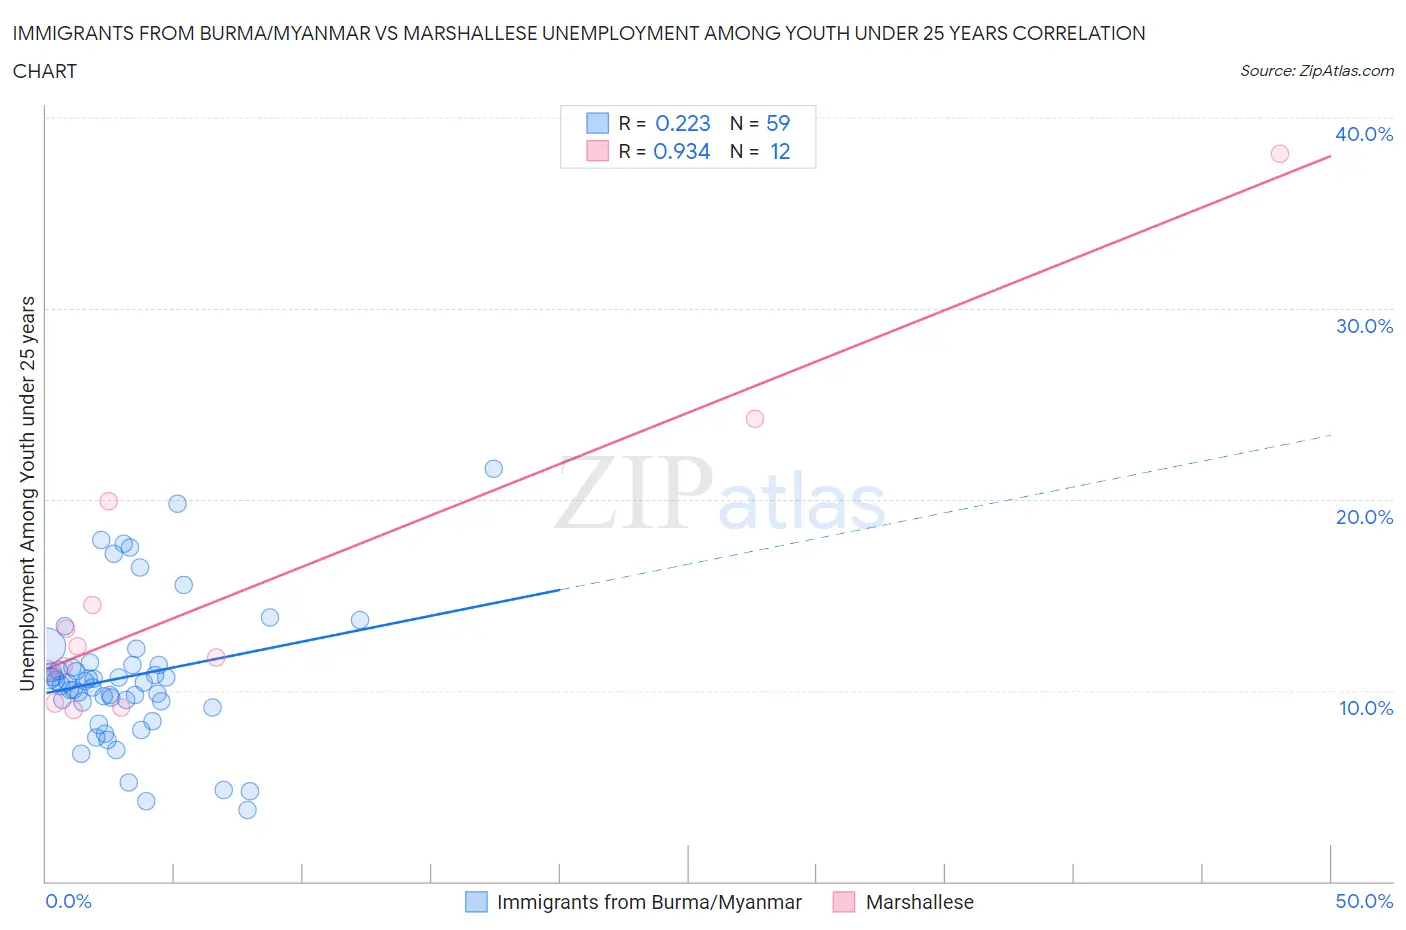
Immigrants from Burma/Myanmar vs Marshallese Unemployment Among Youth under 25 years Correlation Chart
The statistical analysis conducted on geographies consisting of 171,764,683 people shows a weak positive correlation between the proportion of Immigrants from Burma/Myanmar and unemployment rate among youth under the age of 25 in the United States with a correlation coefficient (R) of 0.223 and weighted average of 10.6%. Similarly, the statistical analysis conducted on geographies consisting of 14,734,190 people shows a near-perfect positive correlation between the proportion of Marshallese and unemployment rate among youth under the age of 25 in the United States with a correlation coefficient (R) of 0.934 and weighted average of 11.8%, a difference of 11.4%.
Unemployment Among Youth under 25 years Correlation Summary
| Measurement | Immigrants from Burma/Myanmar | Marshallese |
| Minimum | 3.7% | 9.0% |
| Maximum | 21.6% | 38.1% |
| Range | 17.9% | 29.1% |
| Mean | 10.7% | 15.3% |
| Median | 10.4% | 12.0% |
| Interquartile 25% (IQ1) | 9.4% | 10.2% |
| Interquartile 75% (IQ3) | 11.3% | 17.2% |
| Interquartile Range (IQR) | 1.9% | 7.0% |
| Standard Deviation (Sample) | 3.6% | 8.5% |
| Standard Deviation (Population) | 3.6% | 8.1% |
Similar Demographics by Unemployment Among Youth under 25 years
Demographics Similar to Immigrants from Burma/Myanmar by Unemployment Among Youth under 25 years
In terms of unemployment among youth under 25 years, the demographic groups most similar to Immigrants from Burma/Myanmar are Swiss (10.6%, a difference of 0.010%), Dutch (10.6%, a difference of 0.020%), Menominee (10.6%, a difference of 0.17%), Sudanese (10.6%, a difference of 0.22%), and Venezuelan (10.6%, a difference of 0.22%).
| Demographics | Rating | Rank | Unemployment Among Youth under 25 years |
| Immigrants | Sudan | 100.0 /100 | #12 | Exceptional 10.5% |
| Indonesians | 100.0 /100 | #13 | Exceptional 10.6% |
| Cubans | 100.0 /100 | #14 | Exceptional 10.6% |
| Sudanese | 100.0 /100 | #15 | Exceptional 10.6% |
| Venezuelans | 100.0 /100 | #16 | Exceptional 10.6% |
| Menominee | 100.0 /100 | #17 | Exceptional 10.6% |
| Swiss | 100.0 /100 | #18 | Exceptional 10.6% |
| Immigrants | Burma/Myanmar | 100.0 /100 | #19 | Exceptional 10.6% |
| Dutch | 100.0 /100 | #20 | Exceptional 10.6% |
| Pennsylvania Germans | 100.0 /100 | #21 | Exceptional 10.6% |
| Belgians | 100.0 /100 | #22 | Exceptional 10.6% |
| Immigrants | Bosnia and Herzegovina | 100.0 /100 | #23 | Exceptional 10.6% |
| Finns | 100.0 /100 | #24 | Exceptional 10.7% |
| Immigrants | North Macedonia | 100.0 /100 | #25 | Exceptional 10.7% |
| Immigrants | India | 100.0 /100 | #26 | Exceptional 10.7% |
Demographics Similar to Marshallese by Unemployment Among Youth under 25 years
In terms of unemployment among youth under 25 years, the demographic groups most similar to Marshallese are Palestinian (11.8%, a difference of 0.020%), Immigrants from Peru (11.8%, a difference of 0.040%), Immigrants from Costa Rica (11.8%, a difference of 0.050%), Peruvian (11.8%, a difference of 0.14%), and Arab (11.8%, a difference of 0.16%).
| Demographics | Rating | Rank | Unemployment Among Youth under 25 years |
| Paraguayans | 27.2 /100 | #195 | Fair 11.7% |
| Egyptians | 26.9 /100 | #196 | Fair 11.7% |
| Koreans | 23.9 /100 | #197 | Fair 11.7% |
| Cherokee | 21.2 /100 | #198 | Fair 11.8% |
| Immigrants | Colombia | 20.9 /100 | #199 | Fair 11.8% |
| Arabs | 18.0 /100 | #200 | Poor 11.8% |
| Palestinians | 16.0 /100 | #201 | Poor 11.8% |
| Marshallese | 15.8 /100 | #202 | Poor 11.8% |
| Immigrants | Peru | 15.3 /100 | #203 | Poor 11.8% |
| Immigrants | Costa Rica | 15.2 /100 | #204 | Poor 11.8% |
| Peruvians | 14.0 /100 | #205 | Poor 11.8% |
| Immigrants | Pakistan | 12.6 /100 | #206 | Poor 11.8% |
| Immigrants | Southern Europe | 12.3 /100 | #207 | Poor 11.8% |
| Comanche | 12.1 /100 | #208 | Poor 11.8% |
| Immigrants | Lebanon | 11.3 /100 | #209 | Poor 11.8% |