Immigrants from Burma/Myanmar vs Portuguese Unemployment Among Youth under 25 years
COMPARE
Immigrants from Burma/Myanmar
Portuguese
Unemployment Among Youth under 25 years
Unemployment Among Youth under 25 years Comparison
Immigrants from Burma/Myanmar
Portuguese
10.6%
UNEMPLOYMENT AMONG YOUTH UNDER 25 YEARS
100.0/ 100
METRIC RATING
19th/ 347
METRIC RANK
11.7%
UNEMPLOYMENT AMONG YOUTH UNDER 25 YEARS
30.3/ 100
METRIC RATING
190th/ 347
METRIC RANK
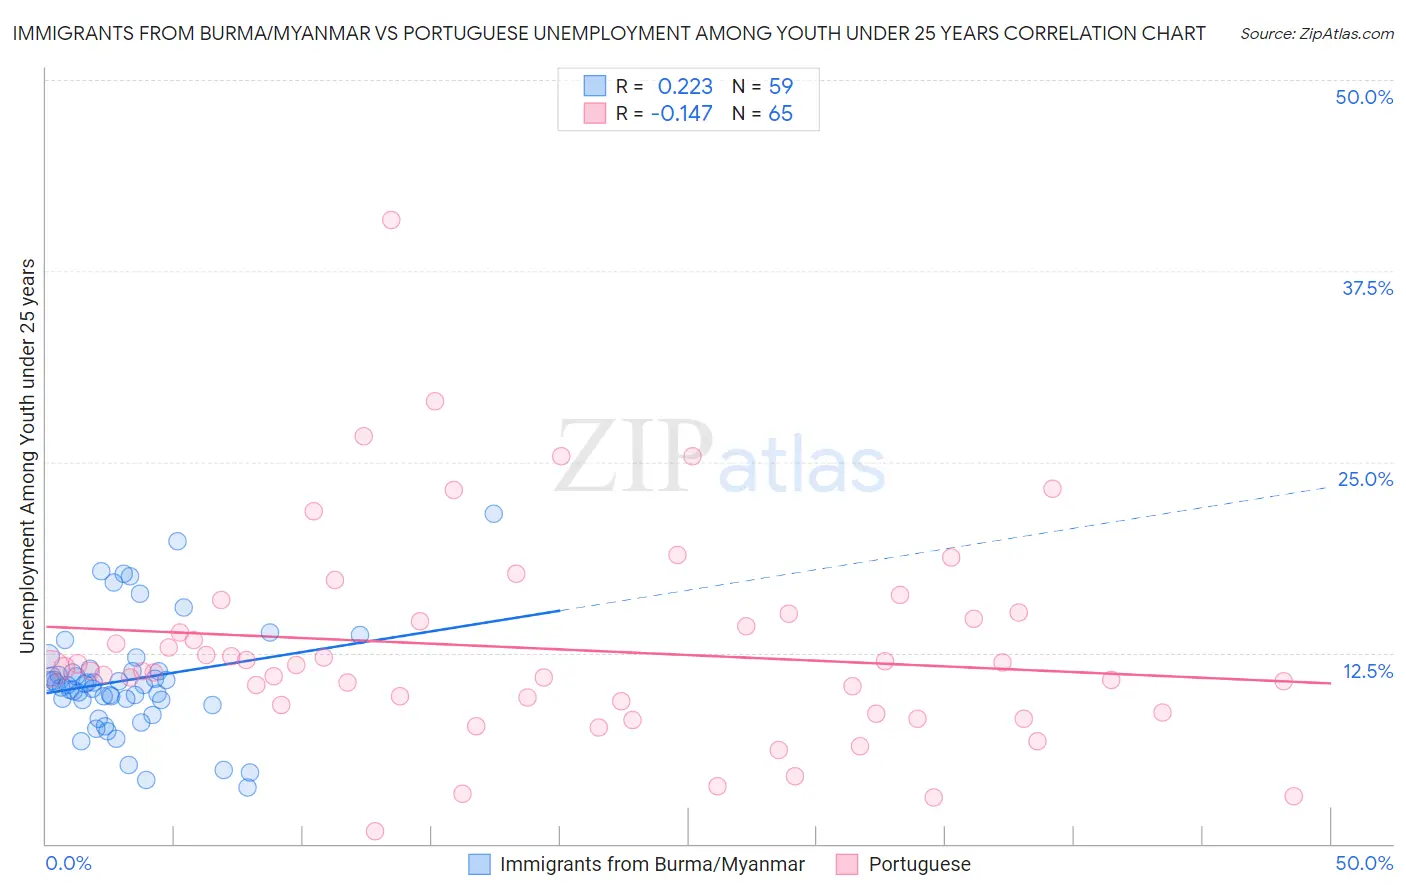
Immigrants from Burma/Myanmar vs Portuguese Unemployment Among Youth under 25 years Correlation Chart
The statistical analysis conducted on geographies consisting of 171,764,683 people shows a weak positive correlation between the proportion of Immigrants from Burma/Myanmar and unemployment rate among youth under the age of 25 in the United States with a correlation coefficient (R) of 0.223 and weighted average of 10.6%. Similarly, the statistical analysis conducted on geographies consisting of 441,524,609 people shows a poor negative correlation between the proportion of Portuguese and unemployment rate among youth under the age of 25 in the United States with a correlation coefficient (R) of -0.147 and weighted average of 11.7%, a difference of 10.4%.
Unemployment Among Youth under 25 years Correlation Summary
| Measurement | Immigrants from Burma/Myanmar | Portuguese |
| Minimum | 3.7% | 0.80% |
| Maximum | 21.6% | 40.8% |
| Range | 17.9% | 40.0% |
| Mean | 10.7% | 12.7% |
| Median | 10.4% | 11.4% |
| Interquartile 25% (IQ1) | 9.4% | 8.9% |
| Interquartile 75% (IQ3) | 11.3% | 14.9% |
| Interquartile Range (IQR) | 1.9% | 6.0% |
| Standard Deviation (Sample) | 3.6% | 6.8% |
| Standard Deviation (Population) | 3.6% | 6.8% |
Similar Demographics by Unemployment Among Youth under 25 years
Demographics Similar to Immigrants from Burma/Myanmar by Unemployment Among Youth under 25 years
In terms of unemployment among youth under 25 years, the demographic groups most similar to Immigrants from Burma/Myanmar are Swiss (10.6%, a difference of 0.010%), Dutch (10.6%, a difference of 0.020%), Menominee (10.6%, a difference of 0.17%), Sudanese (10.6%, a difference of 0.22%), and Venezuelan (10.6%, a difference of 0.22%).
| Demographics | Rating | Rank | Unemployment Among Youth under 25 years |
| Immigrants | Sudan | 100.0 /100 | #12 | Exceptional 10.5% |
| Indonesians | 100.0 /100 | #13 | Exceptional 10.6% |
| Cubans | 100.0 /100 | #14 | Exceptional 10.6% |
| Sudanese | 100.0 /100 | #15 | Exceptional 10.6% |
| Venezuelans | 100.0 /100 | #16 | Exceptional 10.6% |
| Menominee | 100.0 /100 | #17 | Exceptional 10.6% |
| Swiss | 100.0 /100 | #18 | Exceptional 10.6% |
| Immigrants | Burma/Myanmar | 100.0 /100 | #19 | Exceptional 10.6% |
| Dutch | 100.0 /100 | #20 | Exceptional 10.6% |
| Pennsylvania Germans | 100.0 /100 | #21 | Exceptional 10.6% |
| Belgians | 100.0 /100 | #22 | Exceptional 10.6% |
| Immigrants | Bosnia and Herzegovina | 100.0 /100 | #23 | Exceptional 10.6% |
| Finns | 100.0 /100 | #24 | Exceptional 10.7% |
| Immigrants | North Macedonia | 100.0 /100 | #25 | Exceptional 10.7% |
| Immigrants | India | 100.0 /100 | #26 | Exceptional 10.7% |
Demographics Similar to Portuguese by Unemployment Among Youth under 25 years
In terms of unemployment among youth under 25 years, the demographic groups most similar to Portuguese are Japanese (11.7%, a difference of 0.020%), Immigrants from Poland (11.7%, a difference of 0.050%), Immigrants from Egypt (11.7%, a difference of 0.080%), Cypriot (11.7%, a difference of 0.090%), and Immigrants from Russia (11.7%, a difference of 0.090%).
| Demographics | Rating | Rank | Unemployment Among Youth under 25 years |
| Americans | 34.5 /100 | #183 | Fair 11.7% |
| Immigrants | Eastern Europe | 34.1 /100 | #184 | Fair 11.7% |
| French American Indians | 34.0 /100 | #185 | Fair 11.7% |
| Maltese | 33.9 /100 | #186 | Fair 11.7% |
| Immigrants | Egypt | 31.9 /100 | #187 | Fair 11.7% |
| Immigrants | Poland | 31.4 /100 | #188 | Fair 11.7% |
| Japanese | 30.8 /100 | #189 | Fair 11.7% |
| Portuguese | 30.3 /100 | #190 | Fair 11.7% |
| Cypriots | 28.5 /100 | #191 | Fair 11.7% |
| Immigrants | Russia | 28.5 /100 | #192 | Fair 11.7% |
| Seminole | 27.9 /100 | #193 | Fair 11.7% |
| Immigrants | Sri Lanka | 27.8 /100 | #194 | Fair 11.7% |
| Paraguayans | 27.2 /100 | #195 | Fair 11.7% |
| Egyptians | 26.9 /100 | #196 | Fair 11.7% |
| Koreans | 23.9 /100 | #197 | Fair 11.7% |