Tlingit-Haida vs Nonimmigrants Unemployment Among Youth under 25 years
COMPARE
Tlingit-Haida
Nonimmigrants
Unemployment Among Youth under 25 years
Unemployment Among Youth under 25 years Comparison
Tlingit-Haida
Nonimmigrants
12.7%
UNEMPLOYMENT AMONG YOUTH UNDER 25 YEARS
0.0/ 100
METRIC RATING
268th/ 347
METRIC RANK
11.9%
UNEMPLOYMENT AMONG YOUTH UNDER 25 YEARS
6.2/ 100
METRIC RATING
219th/ 347
METRIC RANK
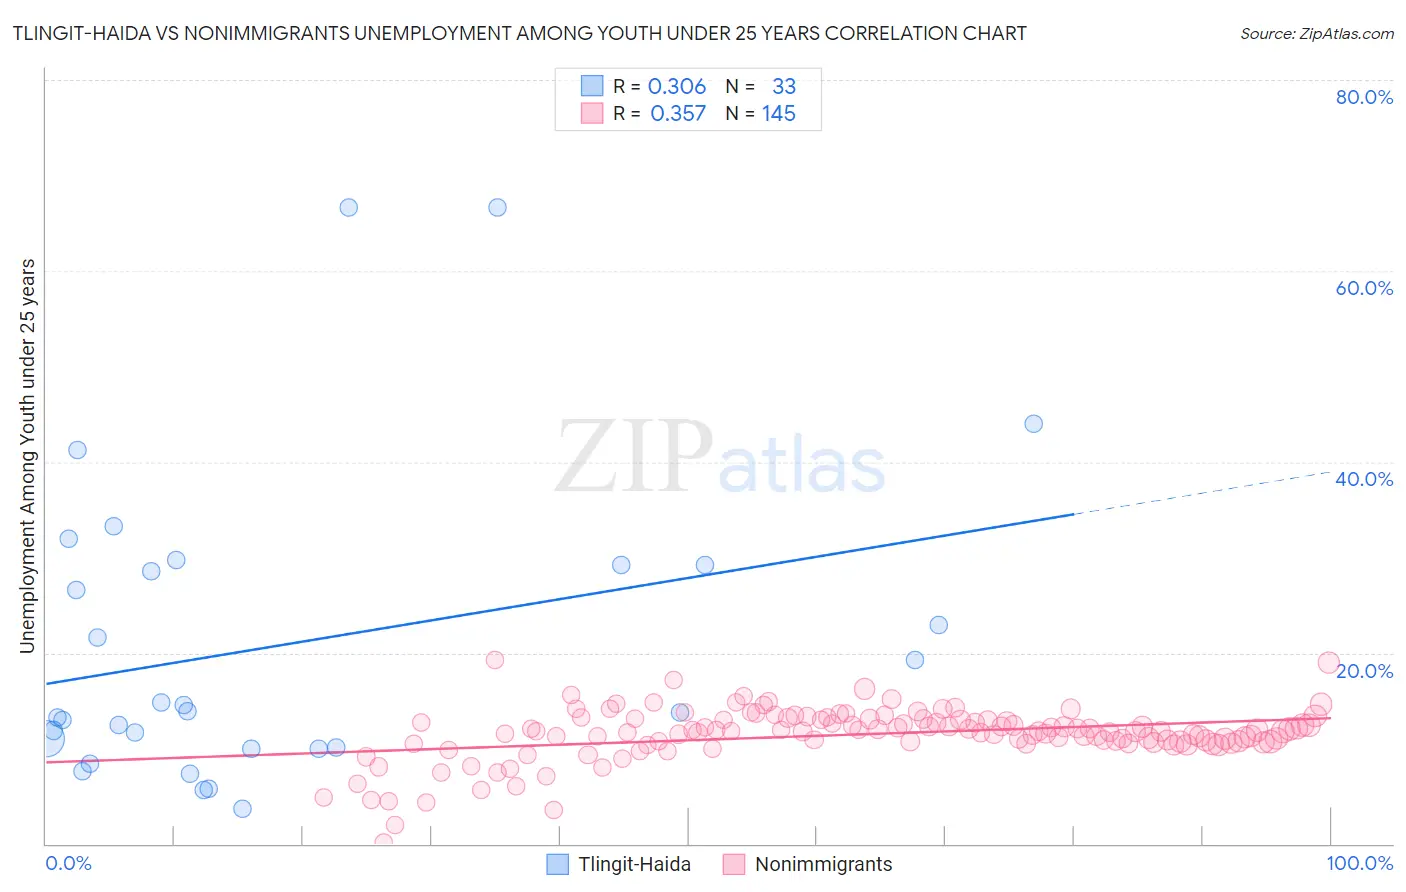
Tlingit-Haida vs Nonimmigrants Unemployment Among Youth under 25 years Correlation Chart
The statistical analysis conducted on geographies consisting of 60,635,463 people shows a mild positive correlation between the proportion of Tlingit-Haida and unemployment rate among youth under the age of 25 in the United States with a correlation coefficient (R) of 0.306 and weighted average of 12.7%. Similarly, the statistical analysis conducted on geographies consisting of 555,778,724 people shows a mild positive correlation between the proportion of Nonimmigrants and unemployment rate among youth under the age of 25 in the United States with a correlation coefficient (R) of 0.357 and weighted average of 11.9%, a difference of 6.1%.
Unemployment Among Youth under 25 years Correlation Summary
| Measurement | Tlingit-Haida | Nonimmigrants |
| Minimum | 3.7% | 0.10% |
| Maximum | 66.6% | 19.2% |
| Range | 62.9% | 19.1% |
| Mean | 20.9% | 11.5% |
| Median | 13.9% | 11.8% |
| Interquartile 25% (IQ1) | 10.1% | 10.7% |
| Interquartile 75% (IQ3) | 29.2% | 13.0% |
| Interquartile Range (IQR) | 19.1% | 2.3% |
| Standard Deviation (Sample) | 15.8% | 2.8% |
| Standard Deviation (Population) | 15.6% | 2.8% |
Similar Demographics by Unemployment Among Youth under 25 years
Demographics Similar to Tlingit-Haida by Unemployment Among Youth under 25 years
In terms of unemployment among youth under 25 years, the demographic groups most similar to Tlingit-Haida are Subsaharan African (12.6%, a difference of 0.080%), Kiowa (12.7%, a difference of 0.12%), Immigrants from Latin America (12.6%, a difference of 0.21%), Nepalese (12.5%, a difference of 1.1%), and Puget Sound Salish (12.5%, a difference of 1.2%).
| Demographics | Rating | Rank | Unemployment Among Youth under 25 years |
| Immigrants | El Salvador | 0.1 /100 | #261 | Tragic 12.4% |
| Immigrants | Mexico | 0.1 /100 | #262 | Tragic 12.4% |
| Cree | 0.1 /100 | #263 | Tragic 12.4% |
| Puget Sound Salish | 0.1 /100 | #264 | Tragic 12.5% |
| Nepalese | 0.0 /100 | #265 | Tragic 12.5% |
| Immigrants | Latin America | 0.0 /100 | #266 | Tragic 12.6% |
| Sub-Saharan Africans | 0.0 /100 | #267 | Tragic 12.6% |
| Tlingit-Haida | 0.0 /100 | #268 | Tragic 12.7% |
| Kiowa | 0.0 /100 | #269 | Tragic 12.7% |
| Immigrants | Liberia | 0.0 /100 | #270 | Tragic 12.8% |
| Immigrants | Bahamas | 0.0 /100 | #271 | Tragic 12.9% |
| Cape Verdeans | 0.0 /100 | #272 | Tragic 12.9% |
| Nigerians | 0.0 /100 | #273 | Tragic 13.0% |
| Immigrants | Nigeria | 0.0 /100 | #274 | Tragic 13.0% |
| Bermudans | 0.0 /100 | #275 | Tragic 13.0% |
Demographics Similar to Nonimmigrants by Unemployment Among Youth under 25 years
In terms of unemployment among youth under 25 years, the demographic groups most similar to Nonimmigrants are Alsatian (11.9%, a difference of 0.020%), Immigrants from Middle Africa (11.9%, a difference of 0.11%), Yaqui (11.9%, a difference of 0.12%), Guamanian/Chamorro (11.9%, a difference of 0.13%), and Samoan (11.9%, a difference of 0.19%).
| Demographics | Rating | Rank | Unemployment Among Youth under 25 years |
| Colombians | 9.1 /100 | #212 | Tragic 11.9% |
| South Americans | 8.5 /100 | #213 | Tragic 11.9% |
| Costa Ricans | 8.2 /100 | #214 | Tragic 11.9% |
| Samoans | 7.4 /100 | #215 | Tragic 11.9% |
| Guamanians/Chamorros | 7.0 /100 | #216 | Tragic 11.9% |
| Yaqui | 6.9 /100 | #217 | Tragic 11.9% |
| Immigrants | Middle Africa | 6.8 /100 | #218 | Tragic 11.9% |
| Immigrants | Nonimmigrants | 6.2 /100 | #219 | Tragic 11.9% |
| Alsatians | 6.1 /100 | #220 | Tragic 11.9% |
| Immigrants | Portugal | 4.9 /100 | #221 | Tragic 12.0% |
| Israelis | 4.1 /100 | #222 | Tragic 12.0% |
| Immigrants | Ireland | 3.5 /100 | #223 | Tragic 12.0% |
| Hawaiians | 3.5 /100 | #224 | Tragic 12.0% |
| Immigrants | Ukraine | 3.0 /100 | #225 | Tragic 12.0% |
| Immigrants | Israel | 2.6 /100 | #226 | Tragic 12.0% |