Immigrants from Burma/Myanmar vs Marshallese Unemployment Among Seniors over 65 years
COMPARE
Immigrants from Burma/Myanmar
Marshallese
Unemployment Among Seniors over 65 years
Unemployment Among Seniors over 65 years Comparison
Immigrants from Burma/Myanmar
Marshallese
4.6%
UNEMPLOYMENT AMONG SENIORS OVER 65 YEARS
100.0/ 100
METRIC RATING
16th/ 347
METRIC RANK
5.3%
UNEMPLOYMENT AMONG SENIORS OVER 65 YEARS
3.1/ 100
METRIC RATING
233rd/ 347
METRIC RANK
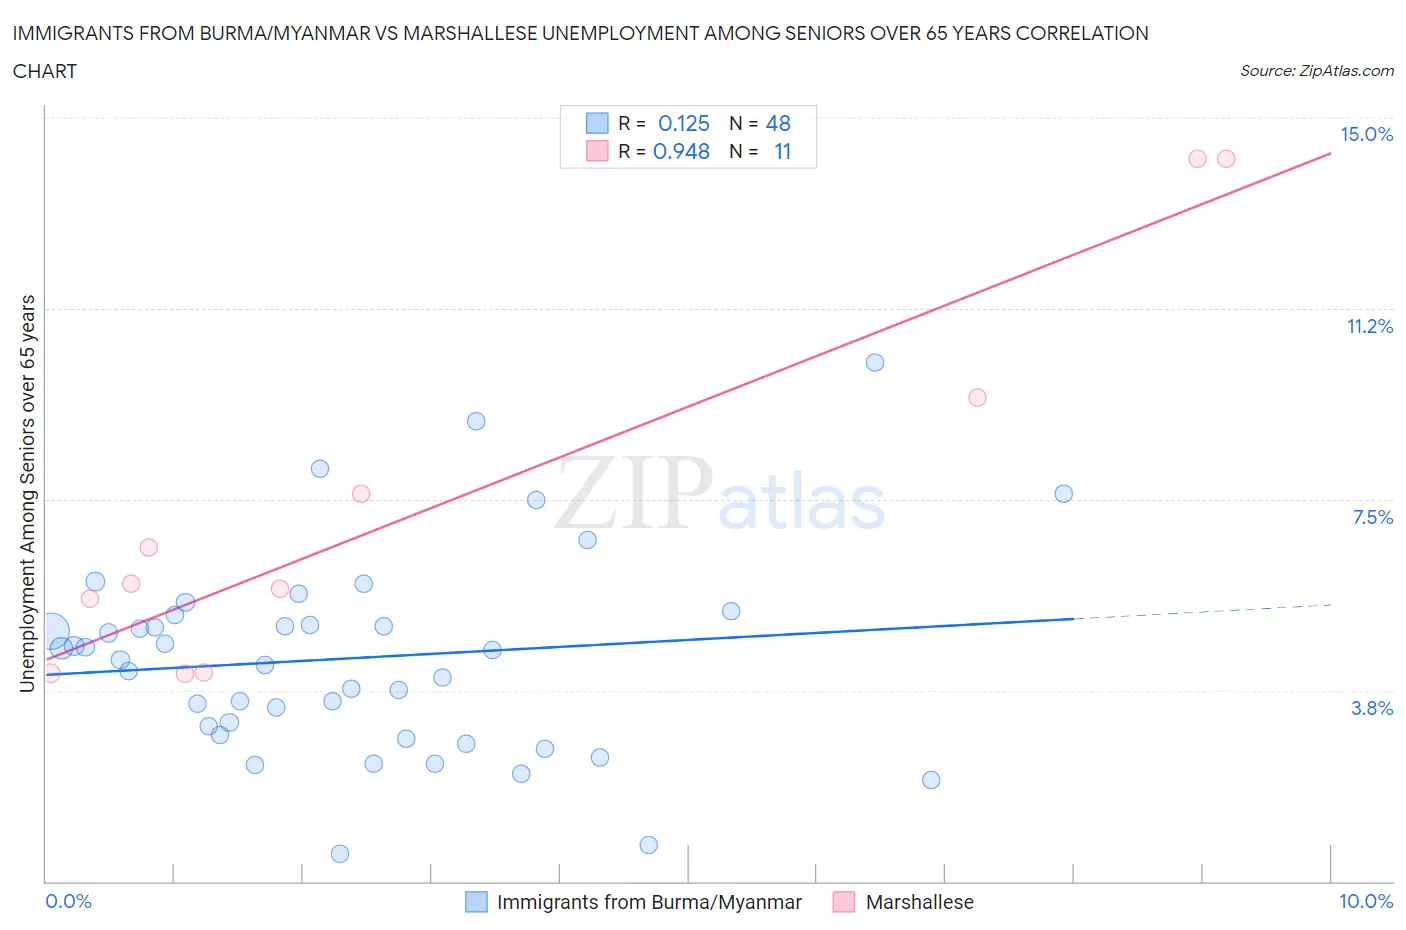
Immigrants from Burma/Myanmar vs Marshallese Unemployment Among Seniors over 65 years Correlation Chart
The statistical analysis conducted on geographies consisting of 164,420,398 people shows a poor positive correlation between the proportion of Immigrants from Burma/Myanmar and unemployment rate amomg seniors over the age of 65 in the United States with a correlation coefficient (R) of 0.125 and weighted average of 4.6%. Similarly, the statistical analysis conducted on geographies consisting of 14,371,080 people shows a near-perfect positive correlation between the proportion of Marshallese and unemployment rate amomg seniors over the age of 65 in the United States with a correlation coefficient (R) of 0.948 and weighted average of 5.3%, a difference of 14.1%.
Unemployment Among Seniors over 65 years Correlation Summary
| Measurement | Immigrants from Burma/Myanmar | Marshallese |
| Minimum | 0.53% | 4.1% |
| Maximum | 10.2% | 14.2% |
| Range | 9.7% | 10.1% |
| Mean | 4.4% | 7.4% |
| Median | 4.4% | 5.9% |
| Interquartile 25% (IQ1) | 3.0% | 4.1% |
| Interquartile 75% (IQ3) | 5.1% | 9.5% |
| Interquartile Range (IQR) | 2.2% | 5.4% |
| Standard Deviation (Sample) | 2.0% | 3.7% |
| Standard Deviation (Population) | 1.9% | 3.6% |
Similar Demographics by Unemployment Among Seniors over 65 years
Demographics Similar to Immigrants from Burma/Myanmar by Unemployment Among Seniors over 65 years
In terms of unemployment among seniors over 65 years, the demographic groups most similar to Immigrants from Burma/Myanmar are Lumbee (4.6%, a difference of 0.010%), Menominee (4.6%, a difference of 0.080%), Creek (4.6%, a difference of 0.11%), Immigrants from Eritrea (4.7%, a difference of 0.40%), and Cuban (4.6%, a difference of 0.52%).
| Demographics | Rating | Rank | Unemployment Among Seniors over 65 years |
| Indonesians | 100.0 /100 | #9 | Exceptional 4.5% |
| Immigrants | Zaire | 100.0 /100 | #10 | Exceptional 4.5% |
| Comanche | 100.0 /100 | #11 | Exceptional 4.6% |
| Osage | 100.0 /100 | #12 | Exceptional 4.6% |
| Cubans | 100.0 /100 | #13 | Exceptional 4.6% |
| Menominee | 100.0 /100 | #14 | Exceptional 4.6% |
| Lumbee | 100.0 /100 | #15 | Exceptional 4.6% |
| Immigrants | Burma/Myanmar | 100.0 /100 | #16 | Exceptional 4.6% |
| Creek | 100.0 /100 | #17 | Exceptional 4.6% |
| Immigrants | Eritrea | 100.0 /100 | #18 | Exceptional 4.7% |
| Lebanese | 100.0 /100 | #19 | Exceptional 4.7% |
| Immigrants | Nepal | 100.0 /100 | #20 | Exceptional 4.7% |
| Norwegians | 100.0 /100 | #21 | Exceptional 4.7% |
| Czechs | 100.0 /100 | #22 | Exceptional 4.7% |
| Kenyans | 100.0 /100 | #23 | Exceptional 4.7% |
Demographics Similar to Marshallese by Unemployment Among Seniors over 65 years
In terms of unemployment among seniors over 65 years, the demographic groups most similar to Marshallese are Blackfeet (5.3%, a difference of 0.0%), Hopi (5.3%, a difference of 0.090%), Immigrants from Albania (5.3%, a difference of 0.10%), Hungarian (5.3%, a difference of 0.17%), and Immigrants from Argentina (5.3%, a difference of 0.20%).
| Demographics | Rating | Rank | Unemployment Among Seniors over 65 years |
| Immigrants | Croatia | 5.3 /100 | #226 | Tragic 5.3% |
| French American Indians | 5.2 /100 | #227 | Tragic 5.3% |
| Haitians | 4.4 /100 | #228 | Tragic 5.3% |
| Samoans | 4.2 /100 | #229 | Tragic 5.3% |
| Immigrants | Argentina | 4.0 /100 | #230 | Tragic 5.3% |
| Hungarians | 3.9 /100 | #231 | Tragic 5.3% |
| Hopi | 3.5 /100 | #232 | Tragic 5.3% |
| Marshallese | 3.1 /100 | #233 | Tragic 5.3% |
| Blackfeet | 3.1 /100 | #234 | Tragic 5.3% |
| Immigrants | Albania | 2.7 /100 | #235 | Tragic 5.3% |
| Immigrants | Costa Rica | 2.1 /100 | #236 | Tragic 5.3% |
| Immigrants | Greece | 2.0 /100 | #237 | Tragic 5.3% |
| Immigrants | Israel | 2.0 /100 | #238 | Tragic 5.3% |
| Immigrants | Senegal | 1.8 /100 | #239 | Tragic 5.3% |
| Immigrants | Trinidad and Tobago | 1.6 /100 | #240 | Tragic 5.3% |