Immigrants from Burma/Myanmar vs Houma Unemployment Among Seniors over 65 years
COMPARE
Immigrants from Burma/Myanmar
Houma
Unemployment Among Seniors over 65 years
Unemployment Among Seniors over 65 years Comparison
Immigrants from Burma/Myanmar
Houma
4.6%
UNEMPLOYMENT AMONG SENIORS OVER 65 YEARS
100.0/ 100
METRIC RATING
16th/ 347
METRIC RANK
4.8%
UNEMPLOYMENT AMONG SENIORS OVER 65 YEARS
100.0/ 100
METRIC RATING
27th/ 347
METRIC RANK
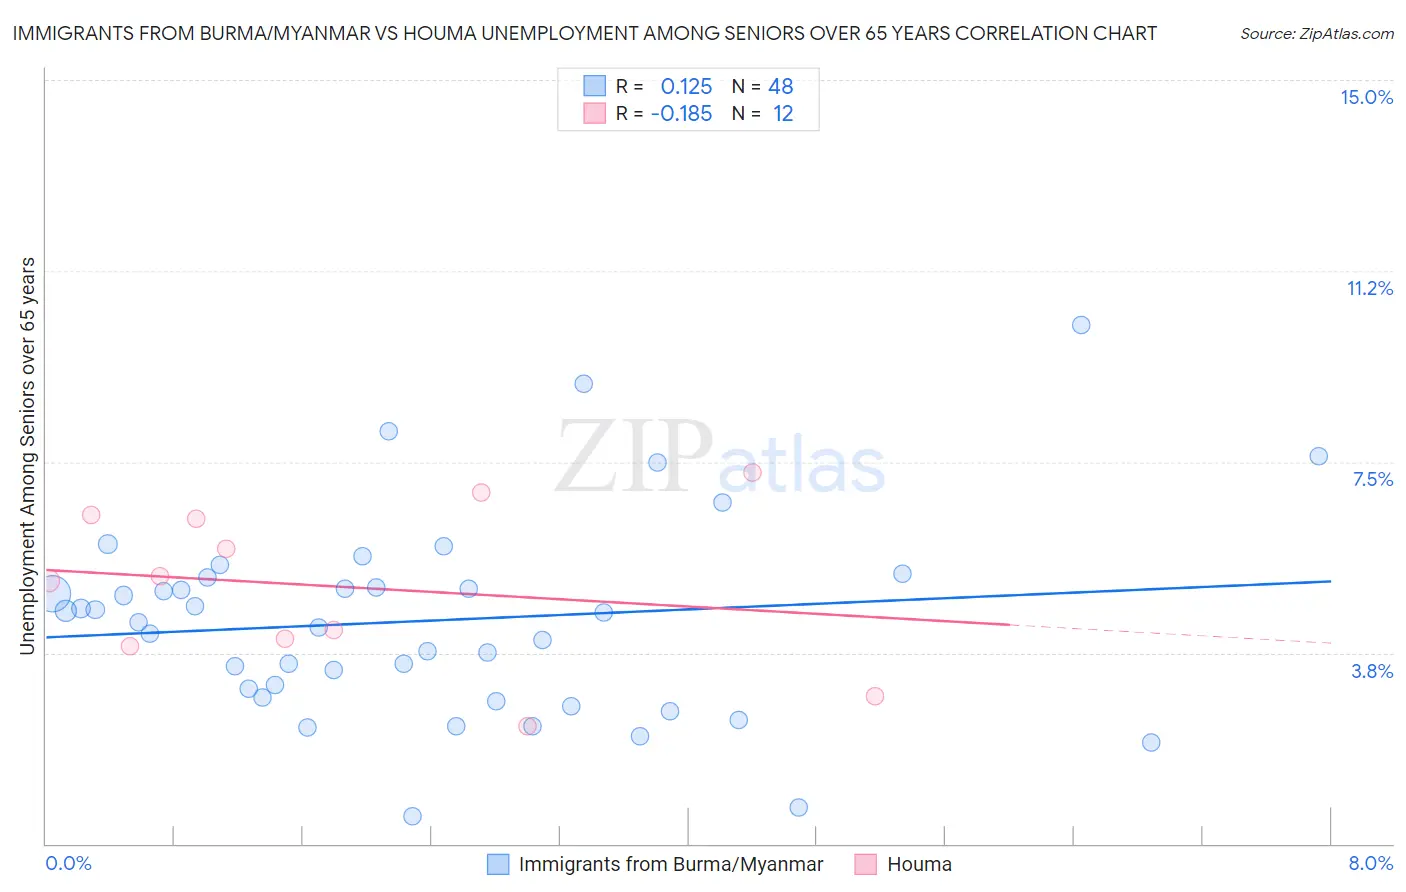
Immigrants from Burma/Myanmar vs Houma Unemployment Among Seniors over 65 years Correlation Chart
The statistical analysis conducted on geographies consisting of 164,420,398 people shows a poor positive correlation between the proportion of Immigrants from Burma/Myanmar and unemployment rate amomg seniors over the age of 65 in the United States with a correlation coefficient (R) of 0.125 and weighted average of 4.6%. Similarly, the statistical analysis conducted on geographies consisting of 35,538,333 people shows a poor negative correlation between the proportion of Houma and unemployment rate amomg seniors over the age of 65 in the United States with a correlation coefficient (R) of -0.185 and weighted average of 4.8%, a difference of 2.9%.
Unemployment Among Seniors over 65 years Correlation Summary
| Measurement | Immigrants from Burma/Myanmar | Houma |
| Minimum | 0.53% | 2.3% |
| Maximum | 10.2% | 7.3% |
| Range | 9.7% | 5.0% |
| Mean | 4.4% | 5.0% |
| Median | 4.4% | 5.2% |
| Interquartile 25% (IQ1) | 3.0% | 4.0% |
| Interquartile 75% (IQ3) | 5.1% | 6.4% |
| Interquartile Range (IQR) | 2.2% | 2.5% |
| Standard Deviation (Sample) | 2.0% | 1.6% |
| Standard Deviation (Population) | 1.9% | 1.5% |
Demographics Similar to Immigrants from Burma/Myanmar and Houma by Unemployment Among Seniors over 65 years
In terms of unemployment among seniors over 65 years, the demographic groups most similar to Immigrants from Burma/Myanmar are Lumbee (4.6%, a difference of 0.010%), Menominee (4.6%, a difference of 0.080%), Creek (4.6%, a difference of 0.11%), Immigrants from Eritrea (4.7%, a difference of 0.40%), and Cuban (4.6%, a difference of 0.52%). Similarly, the demographic groups most similar to Houma are Immigrants from Lebanon (4.8%, a difference of 0.070%), Ugandan (4.8%, a difference of 0.080%), Immigrants from North Macedonia (4.8%, a difference of 0.17%), Tongan (4.7%, a difference of 0.45%), and Belgian (4.8%, a difference of 0.57%).
| Demographics | Rating | Rank | Unemployment Among Seniors over 65 years |
| Comanche | 100.0 /100 | #11 | Exceptional 4.6% |
| Osage | 100.0 /100 | #12 | Exceptional 4.6% |
| Cubans | 100.0 /100 | #13 | Exceptional 4.6% |
| Menominee | 100.0 /100 | #14 | Exceptional 4.6% |
| Lumbee | 100.0 /100 | #15 | Exceptional 4.6% |
| Immigrants | Burma/Myanmar | 100.0 /100 | #16 | Exceptional 4.6% |
| Creek | 100.0 /100 | #17 | Exceptional 4.6% |
| Immigrants | Eritrea | 100.0 /100 | #18 | Exceptional 4.7% |
| Lebanese | 100.0 /100 | #19 | Exceptional 4.7% |
| Immigrants | Nepal | 100.0 /100 | #20 | Exceptional 4.7% |
| Norwegians | 100.0 /100 | #21 | Exceptional 4.7% |
| Czechs | 100.0 /100 | #22 | Exceptional 4.7% |
| Kenyans | 100.0 /100 | #23 | Exceptional 4.7% |
| Iraqis | 100.0 /100 | #24 | Exceptional 4.7% |
| Tongans | 100.0 /100 | #25 | Exceptional 4.7% |
| Immigrants | Lebanon | 100.0 /100 | #26 | Exceptional 4.8% |
| Houma | 100.0 /100 | #27 | Exceptional 4.8% |
| Ugandans | 100.0 /100 | #28 | Exceptional 4.8% |
| Immigrants | North Macedonia | 100.0 /100 | #29 | Exceptional 4.8% |
| Belgians | 100.0 /100 | #30 | Exceptional 4.8% |
| Immigrants | Uganda | 100.0 /100 | #31 | Exceptional 4.8% |