Immigrants from the Azores vs Carpatho Rusyn Unemployment Among Women with Children Ages 6 to 17 years
COMPARE
Immigrants from the Azores
Carpatho Rusyn
Unemployment Among Women with Children Ages 6 to 17 years
Unemployment Among Women with Children Ages 6 to 17 years Comparison
Immigrants from the Azores
Carpatho Rusyns
9.3%
UNEMPLOYMENT AMONG WOMEN WITH CHILDREN AGES 6 TO 17 YEARS
4.6/ 100
METRIC RATING
226th/ 347
METRIC RANK
10.0%
UNEMPLOYMENT AMONG WOMEN WITH CHILDREN AGES 6 TO 17 YEARS
0.0/ 100
METRIC RATING
292nd/ 347
METRIC RANK
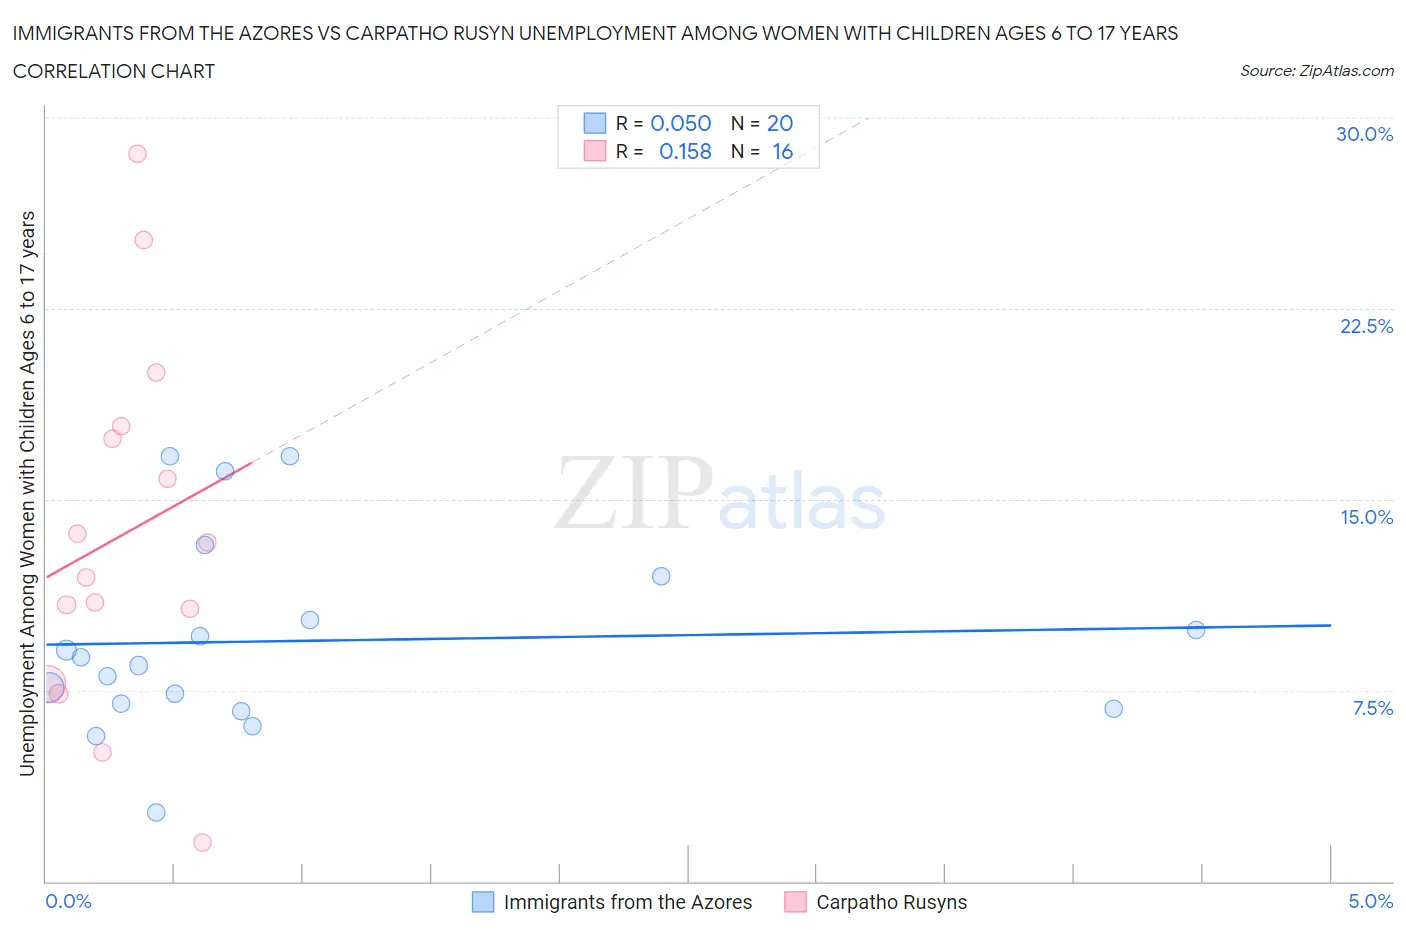
Immigrants from the Azores vs Carpatho Rusyn Unemployment Among Women with Children Ages 6 to 17 years Correlation Chart
The statistical analysis conducted on geographies consisting of 39,080,392 people shows no correlation between the proportion of Immigrants from the Azores and unemployment rate among women with children between the ages 6 and 17 in the United States with a correlation coefficient (R) of 0.050 and weighted average of 9.3%. Similarly, the statistical analysis conducted on geographies consisting of 51,221,084 people shows a poor positive correlation between the proportion of Carpatho Rusyns and unemployment rate among women with children between the ages 6 and 17 in the United States with a correlation coefficient (R) of 0.158 and weighted average of 10.0%, a difference of 8.0%.
Unemployment Among Women with Children Ages 6 to 17 years Correlation Summary
| Measurement | Immigrants from the Azores | Carpatho Rusyn |
| Minimum | 2.7% | 1.5% |
| Maximum | 16.7% | 28.6% |
| Range | 14.0% | 27.1% |
| Mean | 9.4% | 13.6% |
| Median | 8.6% | 12.6% |
| Interquartile 25% (IQ1) | 6.9% | 9.2% |
| Interquartile 75% (IQ3) | 11.1% | 17.6% |
| Interquartile Range (IQR) | 4.2% | 8.4% |
| Standard Deviation (Sample) | 3.8% | 7.1% |
| Standard Deviation (Population) | 3.7% | 6.9% |
Similar Demographics by Unemployment Among Women with Children Ages 6 to 17 years
Demographics Similar to Immigrants from the Azores by Unemployment Among Women with Children Ages 6 to 17 years
In terms of unemployment among women with children ages 6 to 17 years, the demographic groups most similar to Immigrants from the Azores are Panamanian (9.3%, a difference of 0.020%), Estonian (9.3%, a difference of 0.050%), Lumbee (9.3%, a difference of 0.080%), Chinese (9.3%, a difference of 0.14%), and Immigrants from El Salvador (9.3%, a difference of 0.15%).
| Demographics | Rating | Rank | Unemployment Among Women with Children Ages 6 to 17 years |
| Immigrants | Scotland | 6.6 /100 | #219 | Tragic 9.2% |
| Belgians | 6.4 /100 | #220 | Tragic 9.2% |
| Crow | 5.8 /100 | #221 | Tragic 9.2% |
| Immigrants | Southern Europe | 5.8 /100 | #222 | Tragic 9.2% |
| Immigrants | Eritrea | 5.8 /100 | #223 | Tragic 9.2% |
| Immigrants | El Salvador | 5.3 /100 | #224 | Tragic 9.3% |
| Chinese | 5.2 /100 | #225 | Tragic 9.3% |
| Immigrants | Azores | 4.6 /100 | #226 | Tragic 9.3% |
| Panamanians | 4.5 /100 | #227 | Tragic 9.3% |
| Estonians | 4.4 /100 | #228 | Tragic 9.3% |
| Lumbee | 4.3 /100 | #229 | Tragic 9.3% |
| Welsh | 4.0 /100 | #230 | Tragic 9.3% |
| Macedonians | 3.9 /100 | #231 | Tragic 9.3% |
| French American Indians | 3.7 /100 | #232 | Tragic 9.3% |
| Immigrants | St. Vincent and the Grenadines | 3.3 /100 | #233 | Tragic 9.3% |
Demographics Similar to Carpatho Rusyns by Unemployment Among Women with Children Ages 6 to 17 years
In terms of unemployment among women with children ages 6 to 17 years, the demographic groups most similar to Carpatho Rusyns are Nonimmigrants (10.0%, a difference of 0.010%), Subsaharan African (10.0%, a difference of 0.030%), Honduran (10.0%, a difference of 0.050%), Haitian (10.0%, a difference of 0.090%), and Ecuadorian (10.0%, a difference of 0.18%).
| Demographics | Rating | Rank | Unemployment Among Women with Children Ages 6 to 17 years |
| Hispanics or Latinos | 0.0 /100 | #285 | Tragic 9.9% |
| Choctaw | 0.0 /100 | #286 | Tragic 9.9% |
| Sierra Leoneans | 0.0 /100 | #287 | Tragic 9.9% |
| Shoshone | 0.0 /100 | #288 | Tragic 10.0% |
| Hondurans | 0.0 /100 | #289 | Tragic 10.0% |
| Sub-Saharan Africans | 0.0 /100 | #290 | Tragic 10.0% |
| Immigrants | Nonimmigrants | 0.0 /100 | #291 | Tragic 10.0% |
| Carpatho Rusyns | 0.0 /100 | #292 | Tragic 10.0% |
| Haitians | 0.0 /100 | #293 | Tragic 10.0% |
| Ecuadorians | 0.0 /100 | #294 | Tragic 10.0% |
| Cherokee | 0.0 /100 | #295 | Tragic 10.0% |
| Immigrants | Western Africa | 0.0 /100 | #296 | Tragic 10.1% |
| Immigrants | Caribbean | 0.0 /100 | #297 | Tragic 10.1% |
| Immigrants | Haiti | 0.0 /100 | #298 | Tragic 10.1% |
| Immigrants | Honduras | 0.0 /100 | #299 | Tragic 10.1% |