Hungarian vs South American Indian Male Unemployment
COMPARE
Hungarian
South American Indian
Male Unemployment
Male Unemployment Comparison
Hungarians
South American Indians
5.2%
MALE UNEMPLOYMENT
85.1/ 100
METRIC RATING
128th/ 347
METRIC RANK
5.5%
MALE UNEMPLOYMENT
7.6/ 100
METRIC RATING
210th/ 347
METRIC RANK
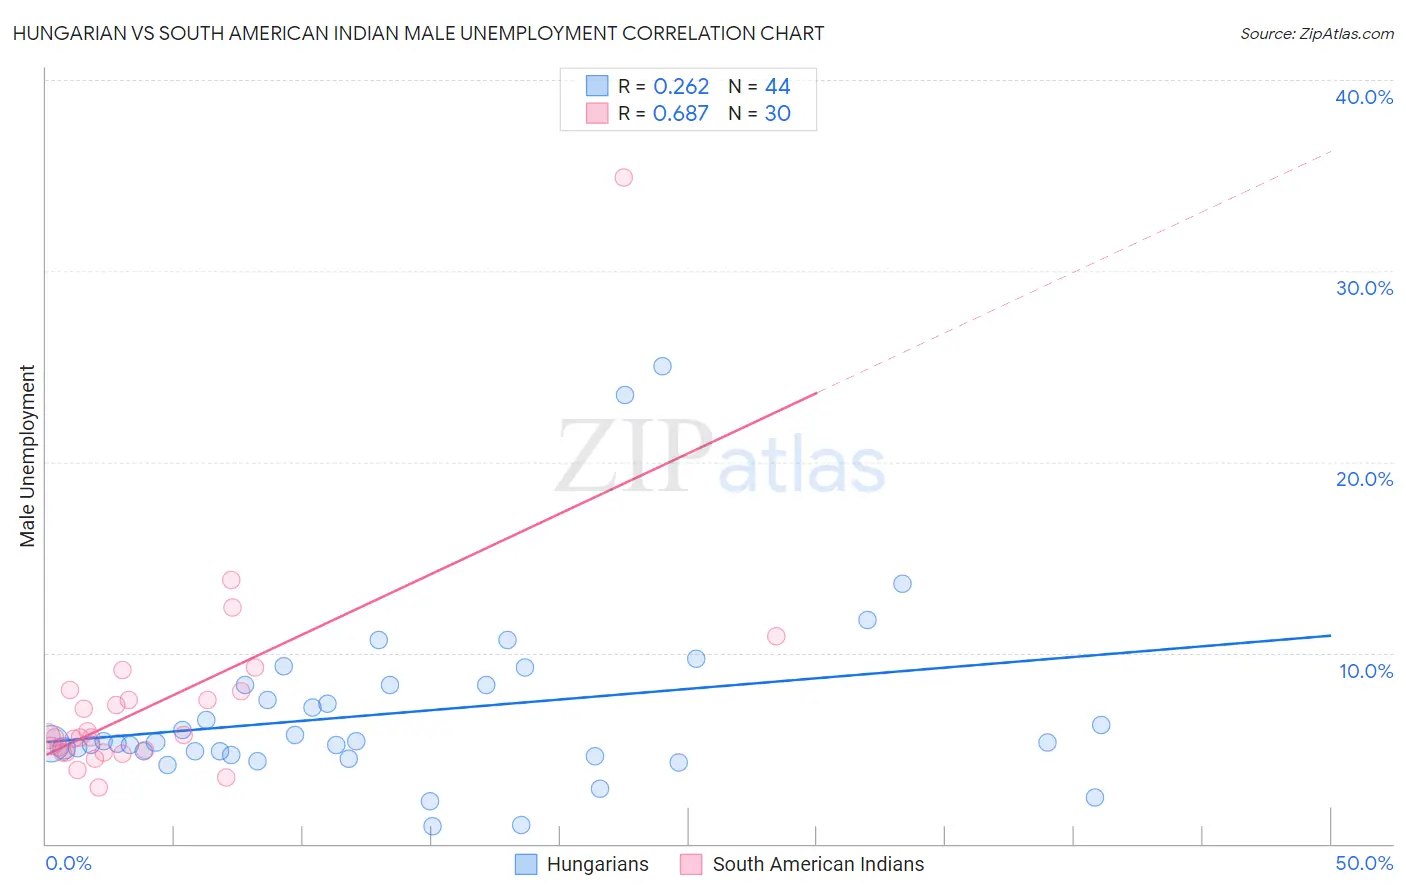
Hungarian vs South American Indian Male Unemployment Correlation Chart
The statistical analysis conducted on geographies consisting of 482,025,300 people shows a weak positive correlation between the proportion of Hungarians and unemployment rate among males in the United States with a correlation coefficient (R) of 0.262 and weighted average of 5.2%. Similarly, the statistical analysis conducted on geographies consisting of 164,403,972 people shows a significant positive correlation between the proportion of South American Indians and unemployment rate among males in the United States with a correlation coefficient (R) of 0.687 and weighted average of 5.5%, a difference of 6.4%.
Male Unemployment Correlation Summary
| Measurement | Hungarian | South American Indian |
| Minimum | 0.92% | 2.9% |
| Maximum | 25.0% | 34.9% |
| Range | 24.1% | 32.0% |
| Mean | 6.9% | 7.5% |
| Median | 5.3% | 5.6% |
| Interquartile 25% (IQ1) | 4.7% | 4.8% |
| Interquartile 75% (IQ3) | 8.3% | 8.0% |
| Interquartile Range (IQR) | 3.6% | 3.2% |
| Standard Deviation (Sample) | 4.7% | 5.8% |
| Standard Deviation (Population) | 4.6% | 5.7% |
Similar Demographics by Male Unemployment
Demographics Similar to Hungarians by Male Unemployment
In terms of male unemployment, the demographic groups most similar to Hungarians are Immigrants from Western Europe (5.2%, a difference of 0.030%), Immigrants from Brazil (5.2%, a difference of 0.15%), Immigrants from Malaysia (5.2%, a difference of 0.18%), Immigrants from Colombia (5.1%, a difference of 0.21%), and Immigrants from Germany (5.2%, a difference of 0.23%).
| Demographics | Rating | Rank | Male Unemployment |
| Mongolians | 88.4 /100 | #121 | Excellent 5.1% |
| Nicaraguans | 88.2 /100 | #122 | Excellent 5.1% |
| Palestinians | 87.7 /100 | #123 | Excellent 5.1% |
| Immigrants | Latvia | 87.5 /100 | #124 | Excellent 5.1% |
| Immigrants | Lithuania | 87.2 /100 | #125 | Excellent 5.1% |
| Immigrants | Colombia | 86.8 /100 | #126 | Excellent 5.1% |
| Immigrants | Brazil | 86.3 /100 | #127 | Excellent 5.2% |
| Hungarians | 85.1 /100 | #128 | Excellent 5.2% |
| Immigrants | Western Europe | 84.8 /100 | #129 | Excellent 5.2% |
| Immigrants | Malaysia | 83.5 /100 | #130 | Excellent 5.2% |
| Immigrants | Germany | 83.0 /100 | #131 | Excellent 5.2% |
| Chickasaw | 82.9 /100 | #132 | Excellent 5.2% |
| Colombians | 81.1 /100 | #133 | Excellent 5.2% |
| Pakistanis | 80.5 /100 | #134 | Excellent 5.2% |
| Immigrants | Saudi Arabia | 80.1 /100 | #135 | Excellent 5.2% |
Demographics Similar to South American Indians by Male Unemployment
In terms of male unemployment, the demographic groups most similar to South American Indians are Israeli (5.5%, a difference of 0.040%), Immigrants from Middle Africa (5.5%, a difference of 0.13%), Hmong (5.5%, a difference of 0.14%), Immigrants from Lebanon (5.5%, a difference of 0.18%), and Ugandan (5.5%, a difference of 0.30%).
| Demographics | Rating | Rank | Male Unemployment |
| Immigrants | Laos | 13.0 /100 | #203 | Poor 5.4% |
| Guamanians/Chamorros | 12.3 /100 | #204 | Poor 5.4% |
| Immigrants | Costa Rica | 11.4 /100 | #205 | Poor 5.5% |
| Immigrants | Ukraine | 9.9 /100 | #206 | Tragic 5.5% |
| Immigrants | Syria | 9.3 /100 | #207 | Tragic 5.5% |
| Immigrants | Lebanon | 8.6 /100 | #208 | Tragic 5.5% |
| Immigrants | Middle Africa | 8.3 /100 | #209 | Tragic 5.5% |
| South American Indians | 7.6 /100 | #210 | Tragic 5.5% |
| Israelis | 7.4 /100 | #211 | Tragic 5.5% |
| Hmong | 7.0 /100 | #212 | Tragic 5.5% |
| Ugandans | 6.3 /100 | #213 | Tragic 5.5% |
| Puget Sound Salish | 5.6 /100 | #214 | Tragic 5.5% |
| Samoans | 4.9 /100 | #215 | Tragic 5.5% |
| Immigrants | Immigrants | 4.3 /100 | #216 | Tragic 5.5% |
| Delaware | 4.2 /100 | #217 | Tragic 5.5% |