Austrian vs South American Indian Male Unemployment
COMPARE
Austrian
South American Indian
Male Unemployment
Male Unemployment Comparison
Austrians
South American Indians
4.9%
MALE UNEMPLOYMENT
98.9/ 100
METRIC RATING
47th/ 347
METRIC RANK
5.5%
MALE UNEMPLOYMENT
7.6/ 100
METRIC RATING
210th/ 347
METRIC RANK
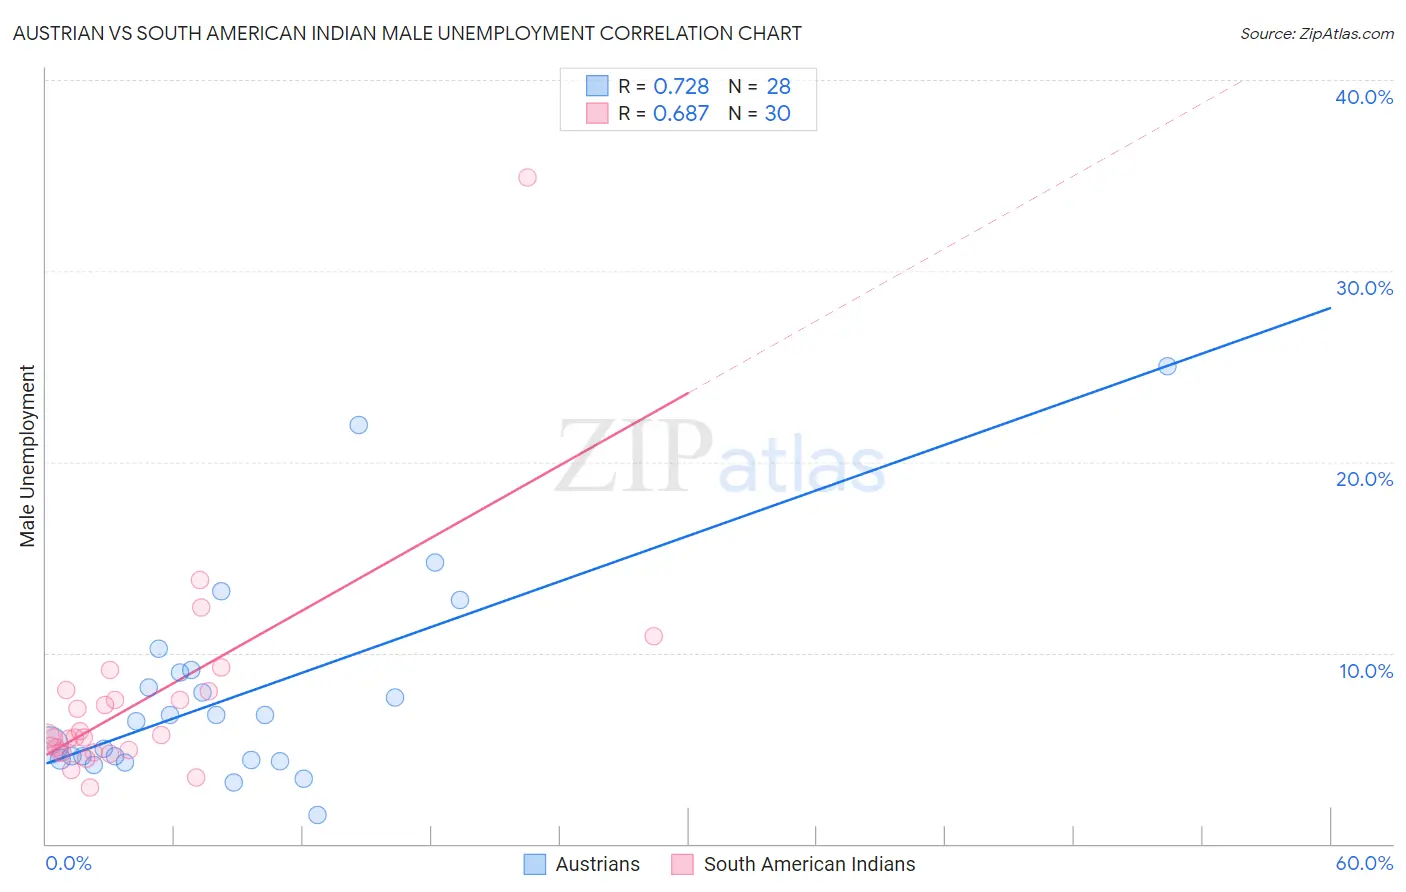
Austrian vs South American Indian Male Unemployment Correlation Chart
The statistical analysis conducted on geographies consisting of 448,962,183 people shows a strong positive correlation between the proportion of Austrians and unemployment rate among males in the United States with a correlation coefficient (R) of 0.728 and weighted average of 4.9%. Similarly, the statistical analysis conducted on geographies consisting of 164,403,972 people shows a significant positive correlation between the proportion of South American Indians and unemployment rate among males in the United States with a correlation coefficient (R) of 0.687 and weighted average of 5.5%, a difference of 10.9%.
Male Unemployment Correlation Summary
| Measurement | Austrian | South American Indian |
| Minimum | 1.5% | 2.9% |
| Maximum | 25.0% | 34.9% |
| Range | 23.5% | 32.0% |
| Mean | 7.8% | 7.5% |
| Median | 6.6% | 5.6% |
| Interquartile 25% (IQ1) | 4.4% | 4.8% |
| Interquartile 75% (IQ3) | 9.0% | 8.0% |
| Interquartile Range (IQR) | 4.6% | 3.2% |
| Standard Deviation (Sample) | 5.4% | 5.8% |
| Standard Deviation (Population) | 5.3% | 5.7% |
Similar Demographics by Male Unemployment
Demographics Similar to Austrians by Male Unemployment
In terms of male unemployment, the demographic groups most similar to Austrians are Immigrants from Scotland (4.9%, a difference of 0.020%), Polish (4.9%, a difference of 0.030%), Croatian (4.9%, a difference of 0.040%), Bhutanese (4.9%, a difference of 0.070%), and Slovene (5.0%, a difference of 0.070%).
| Demographics | Rating | Rank | Male Unemployment |
| Northern Europeans | 99.3 /100 | #40 | Exceptional 4.9% |
| Chinese | 99.3 /100 | #41 | Exceptional 4.9% |
| Immigrants | Belgium | 99.2 /100 | #42 | Exceptional 4.9% |
| Immigrants | Japan | 99.2 /100 | #43 | Exceptional 4.9% |
| Immigrants | Korea | 99.1 /100 | #44 | Exceptional 4.9% |
| Immigrants | Zimbabwe | 99.0 /100 | #45 | Exceptional 4.9% |
| Bhutanese | 98.9 /100 | #46 | Exceptional 4.9% |
| Austrians | 98.9 /100 | #47 | Exceptional 4.9% |
| Immigrants | Scotland | 98.9 /100 | #48 | Exceptional 4.9% |
| Poles | 98.9 /100 | #49 | Exceptional 4.9% |
| Croatians | 98.9 /100 | #50 | Exceptional 4.9% |
| Slovenes | 98.8 /100 | #51 | Exceptional 5.0% |
| Irish | 98.8 /100 | #52 | Exceptional 5.0% |
| Jordanians | 98.8 /100 | #53 | Exceptional 5.0% |
| Yugoslavians | 98.7 /100 | #54 | Exceptional 5.0% |
Demographics Similar to South American Indians by Male Unemployment
In terms of male unemployment, the demographic groups most similar to South American Indians are Israeli (5.5%, a difference of 0.040%), Immigrants from Middle Africa (5.5%, a difference of 0.13%), Hmong (5.5%, a difference of 0.14%), Immigrants from Lebanon (5.5%, a difference of 0.18%), and Ugandan (5.5%, a difference of 0.30%).
| Demographics | Rating | Rank | Male Unemployment |
| Immigrants | Laos | 13.0 /100 | #203 | Poor 5.4% |
| Guamanians/Chamorros | 12.3 /100 | #204 | Poor 5.4% |
| Immigrants | Costa Rica | 11.4 /100 | #205 | Poor 5.5% |
| Immigrants | Ukraine | 9.9 /100 | #206 | Tragic 5.5% |
| Immigrants | Syria | 9.3 /100 | #207 | Tragic 5.5% |
| Immigrants | Lebanon | 8.6 /100 | #208 | Tragic 5.5% |
| Immigrants | Middle Africa | 8.3 /100 | #209 | Tragic 5.5% |
| South American Indians | 7.6 /100 | #210 | Tragic 5.5% |
| Israelis | 7.4 /100 | #211 | Tragic 5.5% |
| Hmong | 7.0 /100 | #212 | Tragic 5.5% |
| Ugandans | 6.3 /100 | #213 | Tragic 5.5% |
| Puget Sound Salish | 5.6 /100 | #214 | Tragic 5.5% |
| Samoans | 4.9 /100 | #215 | Tragic 5.5% |
| Immigrants | Immigrants | 4.3 /100 | #216 | Tragic 5.5% |
| Delaware | 4.2 /100 | #217 | Tragic 5.5% |