Hungarian vs Immigrants from South Africa Male Unemployment
COMPARE
Hungarian
Immigrants from South Africa
Male Unemployment
Male Unemployment Comparison
Hungarians
Immigrants from South Africa
5.2%
MALE UNEMPLOYMENT
85.1/ 100
METRIC RATING
128th/ 347
METRIC RANK
5.0%
MALE UNEMPLOYMENT
97.1/ 100
METRIC RATING
72nd/ 347
METRIC RANK
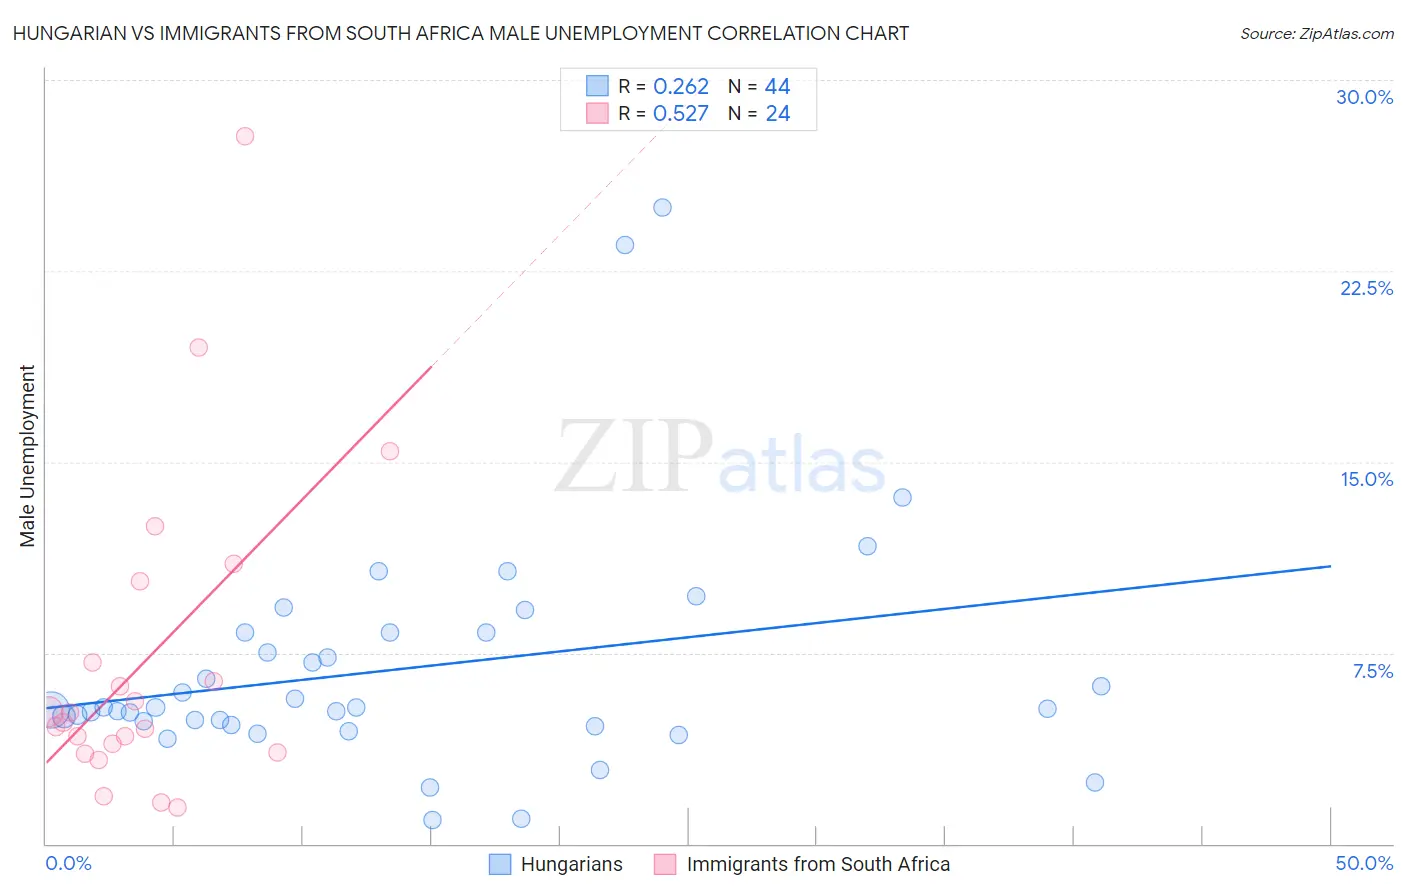
Hungarian vs Immigrants from South Africa Male Unemployment Correlation Chart
The statistical analysis conducted on geographies consisting of 482,025,300 people shows a weak positive correlation between the proportion of Hungarians and unemployment rate among males in the United States with a correlation coefficient (R) of 0.262 and weighted average of 5.2%. Similarly, the statistical analysis conducted on geographies consisting of 232,631,377 people shows a substantial positive correlation between the proportion of Immigrants from South Africa and unemployment rate among males in the United States with a correlation coefficient (R) of 0.527 and weighted average of 5.0%, a difference of 2.7%.
Male Unemployment Correlation Summary
| Measurement | Hungarian | Immigrants from South Africa |
| Minimum | 0.92% | 1.4% |
| Maximum | 25.0% | 27.8% |
| Range | 24.1% | 26.4% |
| Mean | 6.9% | 7.2% |
| Median | 5.3% | 5.0% |
| Interquartile 25% (IQ1) | 4.7% | 3.8% |
| Interquartile 75% (IQ3) | 8.3% | 8.7% |
| Interquartile Range (IQR) | 3.6% | 5.0% |
| Standard Deviation (Sample) | 4.7% | 6.2% |
| Standard Deviation (Population) | 4.6% | 6.1% |
Similar Demographics by Male Unemployment
Demographics Similar to Hungarians by Male Unemployment
In terms of male unemployment, the demographic groups most similar to Hungarians are Immigrants from Western Europe (5.2%, a difference of 0.030%), Immigrants from Brazil (5.2%, a difference of 0.15%), Immigrants from Malaysia (5.2%, a difference of 0.18%), Immigrants from Colombia (5.1%, a difference of 0.21%), and Immigrants from Germany (5.2%, a difference of 0.23%).
| Demographics | Rating | Rank | Male Unemployment |
| Mongolians | 88.4 /100 | #121 | Excellent 5.1% |
| Nicaraguans | 88.2 /100 | #122 | Excellent 5.1% |
| Palestinians | 87.7 /100 | #123 | Excellent 5.1% |
| Immigrants | Latvia | 87.5 /100 | #124 | Excellent 5.1% |
| Immigrants | Lithuania | 87.2 /100 | #125 | Excellent 5.1% |
| Immigrants | Colombia | 86.8 /100 | #126 | Excellent 5.1% |
| Immigrants | Brazil | 86.3 /100 | #127 | Excellent 5.2% |
| Hungarians | 85.1 /100 | #128 | Excellent 5.2% |
| Immigrants | Western Europe | 84.8 /100 | #129 | Excellent 5.2% |
| Immigrants | Malaysia | 83.5 /100 | #130 | Excellent 5.2% |
| Immigrants | Germany | 83.0 /100 | #131 | Excellent 5.2% |
| Chickasaw | 82.9 /100 | #132 | Excellent 5.2% |
| Colombians | 81.1 /100 | #133 | Excellent 5.2% |
| Pakistanis | 80.5 /100 | #134 | Excellent 5.2% |
| Immigrants | Saudi Arabia | 80.1 /100 | #135 | Excellent 5.2% |
Demographics Similar to Immigrants from South Africa by Male Unemployment
In terms of male unemployment, the demographic groups most similar to Immigrants from South Africa are New Zealander (5.0%, a difference of 0.070%), Greek (5.0%, a difference of 0.080%), White/Caucasian (5.0%, a difference of 0.090%), Immigrants from North America (5.0%, a difference of 0.11%), and Assyrian/Chaldean/Syriac (5.0%, a difference of 0.14%).
| Demographics | Rating | Rank | Male Unemployment |
| Icelanders | 97.6 /100 | #65 | Exceptional 5.0% |
| Finns | 97.5 /100 | #66 | Exceptional 5.0% |
| Immigrants | Canada | 97.5 /100 | #67 | Exceptional 5.0% |
| Australians | 97.4 /100 | #68 | Exceptional 5.0% |
| Immigrants | Sweden | 97.4 /100 | #69 | Exceptional 5.0% |
| Whites/Caucasians | 97.3 /100 | #70 | Exceptional 5.0% |
| New Zealanders | 97.3 /100 | #71 | Exceptional 5.0% |
| Immigrants | South Africa | 97.1 /100 | #72 | Exceptional 5.0% |
| Greeks | 97.0 /100 | #73 | Exceptional 5.0% |
| Immigrants | North America | 96.9 /100 | #74 | Exceptional 5.0% |
| Assyrians/Chaldeans/Syriacs | 96.9 /100 | #75 | Exceptional 5.0% |
| Immigrants | Sudan | 96.5 /100 | #76 | Exceptional 5.0% |
| Iranians | 96.4 /100 | #77 | Exceptional 5.0% |
| Immigrants | Northern Europe | 96.4 /100 | #78 | Exceptional 5.0% |
| South Africans | 96.4 /100 | #79 | Exceptional 5.0% |