Hungarian vs Immigrants from Hungary Male Unemployment

COMPARE

Hungarian
Race
Ancestry
AfghanAfricanAlaska NativeAlaskan AthabascanAlbanianAleutAlsatianAmericanApacheArabArapahoArgentineanArmenianAssyrian/Chaldean/SyriacAustralianAustrianBahamianBangladeshiBarbadianBasqueBelgianBelizeanBermudanBhutaneseBlackfeetBolivianBrazilianBritishBritish West IndianBulgarianBurmeseCajunCambodianCanadianCape VerdeanCarpatho RusynCelticCentral AmericanCentral American IndianCherokeeCheyenneChickasawChileanChineseChippewaChoctawColombianColvilleComancheCosta RicanCreeCreekCroatianCrowCubanCypriotCzechCzechoslovakianDanishDelawareDominicanDutchDutch West IndianEastern EuropeanEcuadorianEgyptianEnglishEstonianEthiopianEuropeanFijianFilipinoFinnishFrenchFrench American IndianFrench CanadianGermanGerman RussianGhanaianGreekGuamanian/ChamorroGuatemalanGuyaneseHaitianHmongHonduranHopiHoumaHungarianIcelanderIndian (Asian)IndonesianInupiatIranianIraqiIrishIroquoisIsraeliItalianJamaicanJapaneseJordanianKenyanKiowaKoreanLaotianLatvianLebaneseLiberianLithuanianLumbeeLuxembourgerMacedonianMalaysianMalteseMarshalleseMenomineeMexicanMexican American IndianMongolianMoroccanNative HawaiianNavajoNepaleseNew ZealanderNicaraguanNigerianNorthern EuropeanNorwegianOkinawanOsageOttawaPaiutePakistaniPalestinianPanamanianParaguayanPennsylvania GermanPeruvianPimaPolishPortuguesePotawatomiPuebloPuerto RicanPuget Sound SalishRomanianRussianSalvadoranSamoanScandinavianScotch-IrishScottishSeminoleSenegaleseSerbianShoshoneSierra LeoneanSiouxSlavicSlovakSloveneSomaliSouth AfricanSouth AmericanSouth American IndianSoviet UnionSpaniardSpanishSpanish AmericanSpanish American IndianSri LankanSubsaharan AfricanSudaneseSwedishSwissSyrianTaiwaneseThaiTlingit-HaidaTohono O'OdhamTonganTrinidadian and TobagonianTsimshianTurkishU.S. Virgin IslanderUgandanUkrainianUruguayanUteVenezuelanVietnameseWelshWest IndianYakamaYaquiYugoslavianYumanYup'ikZimbabwean
Immigration
NonimmigrantsImmigrantsAfghanistanAfricaAlbaniaArgentinaArmeniaAsiaAustraliaAustriaBahamasBangladeshBarbadosBelarusBelgiumBelizeBoliviaBosnia and HerzegovinaBrazilBulgariaBurma/MyanmarCabo VerdeCambodiaCameroonCanadaCaribbeanCentral AmericaChileChinaColombiaCongoCosta RicaCroatiaCubaCzechoslovakiaDenmarkDominicaDominican RepublicEastern AfricaEastern AsiaEastern EuropeEcuadorEgyptEl SalvadorEnglandEritreaEthiopiaEuropeFijiFranceGermanyGhanaGreeceGrenadaGuatemalaGuyanaHaitiHondurasHong KongIndiaIndonesiaIranIraqIrelandIsraelItalyJamaicaJapanJordanKazakhstanKenyaKoreaKuwaitLaosLatin AmericaLatviaLebanonLiberiaLithuaniaMalaysiaMexicoMicronesiaMiddle AfricaMoldovaMoroccoNepalNetherlandsNicaraguaNigeriaNorth AmericaNorth MacedoniaNorthern AfricaNorthern EuropeNorwayOceaniaPakistanPanamaPeruPhilippinesPolandPortugalRomaniaRussiaSaudi ArabiaScotlandSenegalSerbiaSierra LeoneSingaporeSomaliaSouth AfricaSouth AmericaSouth Central AsiaSouth Eastern AsiaSouthern EuropeSpainSri LankaSt. Vincent and the GrenadinesSudanSwedenSwitzerlandSyriaTaiwanThailandTrinidad and TobagoTurkeyUgandaUkraineUruguayUzbekistanVenezuelaVietnamWest IndiesWestern AfricaWestern AsiaWestern EuropeYemenZaireZimbabweAzores
Immigrants from Hungary
Race
Ancestry
AfghanAfricanAlaska NativeAlaskan AthabascanAlbanianAleutAlsatianAmericanApacheArabArapahoArgentineanArmenianAssyrian/Chaldean/SyriacAustralianAustrianBahamianBangladeshiBarbadianBasqueBelgianBelizeanBermudanBhutaneseBlackfeetBolivianBrazilianBritishBritish West IndianBulgarianBurmeseCajunCambodianCanadianCape VerdeanCarpatho RusynCelticCentral AmericanCentral American IndianCherokeeCheyenneChickasawChileanChineseChippewaChoctawColombianColvilleComancheCosta RicanCreeCreekCroatianCrowCubanCypriotCzechCzechoslovakianDanishDelawareDominicanDutchDutch West IndianEastern EuropeanEcuadorianEgyptianEnglishEstonianEthiopianEuropeanFijianFilipinoFinnishFrenchFrench American IndianFrench CanadianGermanGerman RussianGhanaianGreekGuamanian/ChamorroGuatemalanGuyaneseHaitianHmongHonduranHopiHoumaIcelanderIndian (Asian)IndonesianInupiatIranianIraqiIrishIroquoisIsraeliItalianJamaicanJapaneseJordanianKenyanKiowaKoreanLaotianLatvianLebaneseLiberianLithuanianLumbeeLuxembourgerMacedonianMalaysianMalteseMarshalleseMenomineeMexicanMexican American IndianMongolianMoroccanNative HawaiianNavajoNepaleseNew ZealanderNicaraguanNigerianNorthern EuropeanNorwegianOkinawanOsageOttawaPaiutePakistaniPalestinianPanamanianParaguayanPennsylvania GermanPeruvianPimaPolishPortuguesePotawatomiPuebloPuerto RicanPuget Sound SalishRomanianRussianSalvadoranSamoanScandinavianScotch-IrishScottishSeminoleSenegaleseSerbianShoshoneSierra LeoneanSiouxSlavicSlovakSloveneSomaliSouth AfricanSouth AmericanSouth American IndianSoviet UnionSpaniardSpanishSpanish AmericanSpanish American IndianSri LankanSubsaharan AfricanSudaneseSwedishSwissSyrianTaiwaneseThaiTlingit-HaidaTohono O'OdhamTonganTrinidadian and TobagonianTsimshianTurkishU.S. Virgin IslanderUgandanUkrainianUruguayanUteVenezuelanVietnameseWelshWest IndianYakamaYaquiYugoslavianYumanYup'ikZimbabwean
Immigration
NonimmigrantsImmigrantsAfghanistanAfricaAlbaniaArgentinaArmeniaAsiaAustraliaAustriaBahamasBangladeshBarbadosBelarusBelgiumBelizeBoliviaBosnia and HerzegovinaBrazilBulgariaBurma/MyanmarCabo VerdeCambodiaCameroonCanadaCaribbeanCentral AmericaChileChinaColombiaCongoCosta RicaCroatiaCubaCzechoslovakiaDenmarkDominicaDominican RepublicEastern AfricaEastern AsiaEastern EuropeEcuadorEgyptEl SalvadorEnglandEritreaEthiopiaEuropeFijiFranceGermanyGhanaGreeceGrenadaGuatemalaGuyanaHaitiHondurasHong KongHungaryIndiaIndonesiaIranIraqIrelandIsraelItalyJamaicaJapanJordanKazakhstanKenyaKoreaKuwaitLaosLatin AmericaLatviaLebanonLiberiaLithuaniaMalaysiaMexicoMicronesiaMiddle AfricaMoldovaMoroccoNepalNetherlandsNicaraguaNigeriaNorth AmericaNorth MacedoniaNorthern AfricaNorthern EuropeNorwayOceaniaPakistanPanamaPeruPhilippinesPolandPortugalRomaniaRussiaSaudi ArabiaScotlandSenegalSerbiaSierra LeoneSingaporeSomaliaSouth AfricaSouth AmericaSouth Central AsiaSouth Eastern AsiaSouthern EuropeSpainSri LankaSt. Vincent and the GrenadinesSudanSwedenSwitzerlandSyriaTaiwanThailandTrinidad and TobagoTurkeyUgandaUkraineUruguayUzbekistanVenezuelaVietnamWest IndiesWestern AfricaWestern AsiaWestern EuropeYemenZaireZimbabweAzores
Male Unemployment
Income
Poverty
Unemployment
Labor Participation
Family Structure
Vehicle Availability
Education Level
Disability

Male Unemployment Comparison

Hungarians

Immigrants from Hungary

Excellent
Good
5.2%
MALE UNEMPLOYMENT
85.1/ 100
METRIC RATING
128th/ 347
METRIC RANK
5.2%
MALE UNEMPLOYMENT
73.4/ 100
METRIC RATING
155th/ 347
METRIC RANK

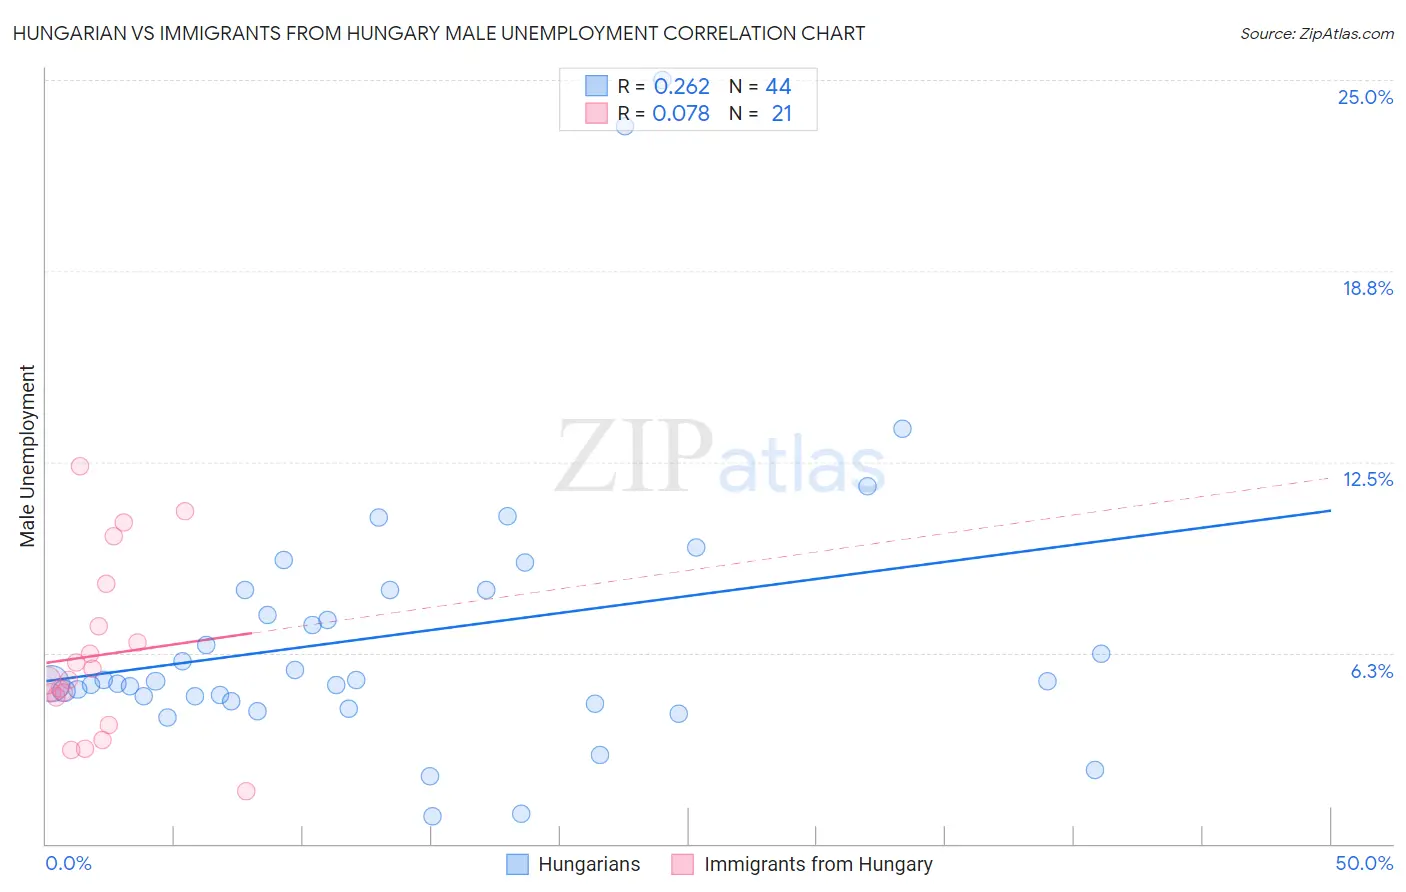
Hungarian vs Immigrants from Hungary Male Unemployment Correlation Chart

The statistical analysis conducted on geographies consisting of 482,025,300 people shows a weak positive correlation between the proportion of Hungarians and unemployment rate among males in the United States with a correlation coefficient (R) of 0.262 and weighted average of 5.2%. Similarly, the statistical analysis conducted on geographies consisting of 195,412,330 people shows a slight positive correlation between the proportion of Immigrants from Hungary and unemployment rate among males in the United States with a correlation coefficient (R) of 0.078 and weighted average of 5.2%, a difference of 1.1%.
Hungarian vs Immigrants from Hungary Male Unemployment

Male Unemployment Correlation Summary

MeasurementHungarianImmigrants from Hungary
Minimum0.92%1.7%
Maximum25.0%12.3%
Range24.1%10.6%
Mean6.9%6.2%
Median5.3%5.4%
Interquartile 25% (IQ1)4.7%4.4%
Interquartile 75% (IQ3)8.3%7.8%
Interquartile Range (IQR)3.6%3.5%
Standard Deviation (Sample)4.7%2.8%
Standard Deviation (Population)4.6%2.8%

Similar Demographics by Male Unemployment

Demographics Similar to Hungarians by Male Unemployment

In terms of male unemployment, the demographic groups most similar to Hungarians are Immigrants from Western Europe (5.2%, a difference of 0.030%), Immigrants from Brazil (5.2%, a difference of 0.15%), Immigrants from Malaysia (5.2%, a difference of 0.18%), Immigrants from Colombia (5.1%, a difference of 0.21%), and Immigrants from Germany (5.2%, a difference of 0.23%).
DemographicsRating | RankMale Unemployment
Mongolians
88.4
/100
|
#121
Excellent
5.1%
Nicaraguans
88.2
/100
|
#122
Excellent
5.1%
Palestinians
87.7
/100
|
#123
Excellent
5.1%
Immigrants | Latvia
87.5
/100
|
#124
Excellent
5.1%
Immigrants | Lithuania
87.2
/100
|
#125
Excellent
5.1%
Immigrants | Colombia
86.8
/100
|
#126
Excellent
5.1%
Immigrants | Brazil
86.3
/100
|
#127
Excellent
5.2%
Hungarians
85.1
/100
|
#128
Excellent
5.2%
Immigrants | Western Europe
84.8
/100
|
#129
Excellent
5.2%
Immigrants | Malaysia
83.5
/100
|
#130
Excellent
5.2%
Immigrants | Germany
83.0
/100
|
#131
Excellent
5.2%
Chickasaw
82.9
/100
|
#132
Excellent
5.2%
Colombians
81.1
/100
|
#133
Excellent
5.2%
Pakistanis
80.5
/100
|
#134
Excellent
5.2%
Immigrants | Saudi Arabia
80.1
/100
|
#135
Excellent
5.2%

Demographics Similar to Immigrants from Hungary by Male Unemployment

In terms of male unemployment, the demographic groups most similar to Immigrants from Hungary are Laotian (5.2%, a difference of 0.030%), Immigrants from Uruguay (5.2%, a difference of 0.040%), American (5.2%, a difference of 0.060%), Immigrants from Northern Africa (5.2%, a difference of 0.080%), and Egyptian (5.2%, a difference of 0.11%).
DemographicsRating | RankMale Unemployment
Immigrants | Italy
76.3
/100
|
#148
Good
5.2%
Immigrants | Europe
76.2
/100
|
#149
Good
5.2%
Indians (Asian)
76.0
/100
|
#150
Good
5.2%
Slovaks
75.5
/100
|
#151
Good
5.2%
Egyptians
74.8
/100
|
#152
Good
5.2%
Immigrants | Uruguay
73.9
/100
|
#153
Good
5.2%
Laotians
73.8
/100
|
#154
Good
5.2%
Immigrants | Hungary
73.4
/100
|
#155
Good
5.2%
Americans
72.7
/100
|
#156
Good
5.2%
Immigrants | Northern Africa
72.3
/100
|
#157
Good
5.2%
Immigrants | Indonesia
71.5
/100
|
#158
Good
5.2%
Indonesians
71.2
/100
|
#159
Good
5.2%
Immigrants | Norway
71.0
/100
|
#160
Good
5.2%
Immigrants | China
70.6
/100
|
#161
Good
5.2%
Immigrants | Egypt
65.9
/100
|
#162
Good
5.2%