Ecuadorian vs Immigrants from Norway Female Unemployment
COMPARE
Ecuadorian
Immigrants from Norway
Female Unemployment
Female Unemployment Comparison
Ecuadorians
Immigrants from Norway
6.3%
FEMALE UNEMPLOYMENT
0.0/ 100
METRIC RATING
309th/ 347
METRIC RANK
5.2%
FEMALE UNEMPLOYMENT
79.4/ 100
METRIC RATING
146th/ 347
METRIC RANK
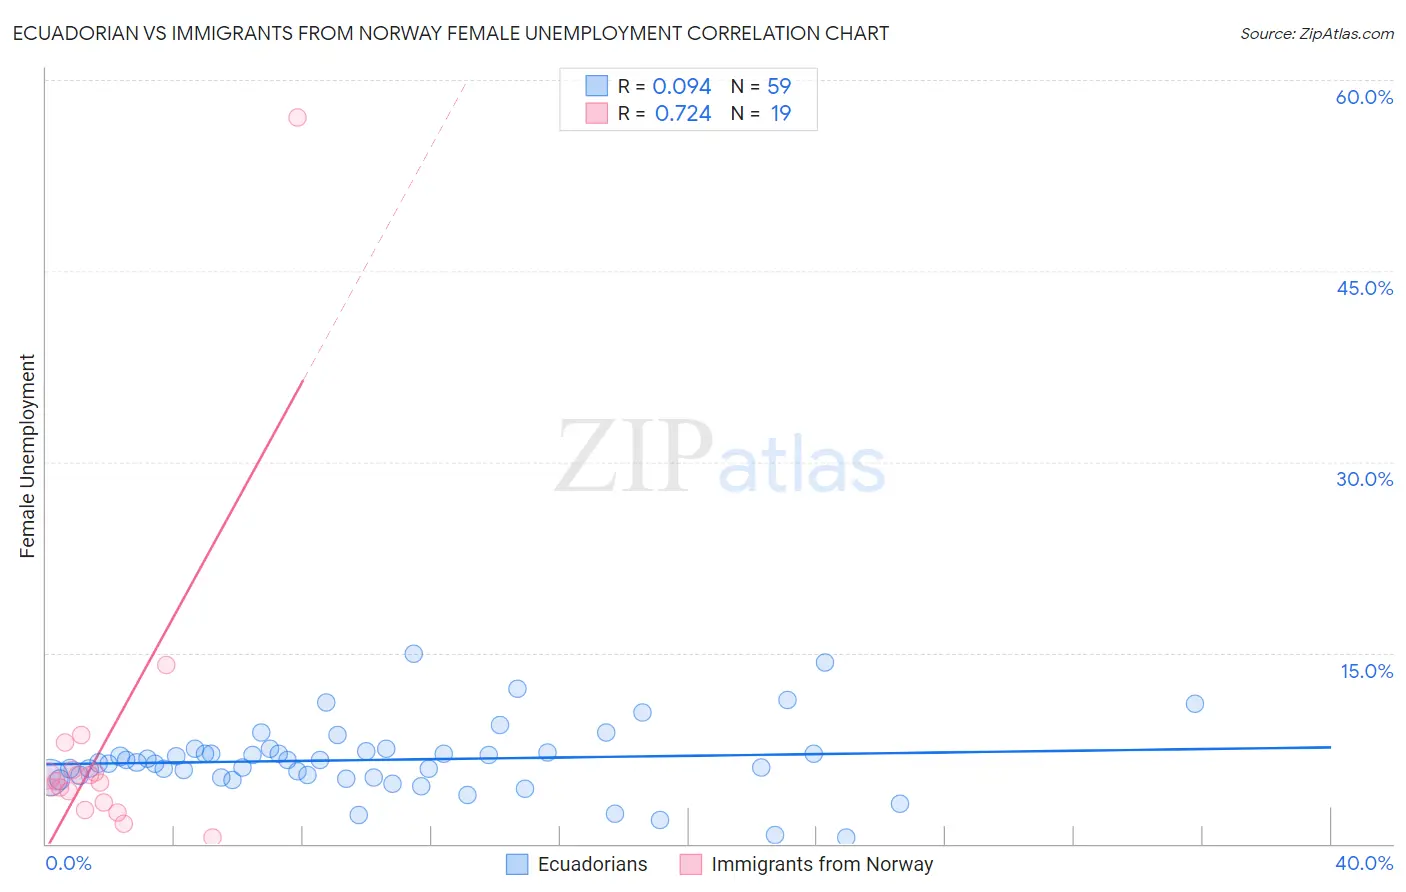
Ecuadorian vs Immigrants from Norway Female Unemployment Correlation Chart
The statistical analysis conducted on geographies consisting of 317,059,726 people shows a slight positive correlation between the proportion of Ecuadorians and unemploymnet rate among females in the United States with a correlation coefficient (R) of 0.094 and weighted average of 6.3%. Similarly, the statistical analysis conducted on geographies consisting of 116,500,173 people shows a strong positive correlation between the proportion of Immigrants from Norway and unemploymnet rate among females in the United States with a correlation coefficient (R) of 0.724 and weighted average of 5.2%, a difference of 21.7%.
Female Unemployment Correlation Summary
| Measurement | Ecuadorian | Immigrants from Norway |
| Minimum | 0.50% | 0.50% |
| Maximum | 14.9% | 57.1% |
| Range | 14.4% | 56.6% |
| Mean | 6.6% | 7.8% |
| Median | 6.4% | 4.9% |
| Interquartile 25% (IQ1) | 5.2% | 3.2% |
| Interquartile 75% (IQ3) | 7.2% | 5.8% |
| Interquartile Range (IQR) | 2.0% | 2.6% |
| Standard Deviation (Sample) | 2.8% | 12.3% |
| Standard Deviation (Population) | 2.7% | 12.0% |
Similar Demographics by Female Unemployment
Demographics Similar to Ecuadorians by Female Unemployment
In terms of female unemployment, the demographic groups most similar to Ecuadorians are Central American Indian (6.3%, a difference of 0.41%), Immigrants from Mexico (6.3%, a difference of 0.54%), Hispanic or Latino (6.2%, a difference of 0.58%), Shoshone (6.2%, a difference of 0.64%), and Immigrants from Central America (6.2%, a difference of 0.66%).
| Demographics | Rating | Rank | Female Unemployment |
| U.S. Virgin Islanders | 0.0 /100 | #302 | Tragic 6.2% |
| Barbadians | 0.0 /100 | #303 | Tragic 6.2% |
| Immigrants | Jamaica | 0.0 /100 | #304 | Tragic 6.2% |
| Spanish American Indians | 0.0 /100 | #305 | Tragic 6.2% |
| Immigrants | Central America | 0.0 /100 | #306 | Tragic 6.2% |
| Shoshone | 0.0 /100 | #307 | Tragic 6.2% |
| Hispanics or Latinos | 0.0 /100 | #308 | Tragic 6.2% |
| Ecuadorians | 0.0 /100 | #309 | Tragic 6.3% |
| Central American Indians | 0.0 /100 | #310 | Tragic 6.3% |
| Immigrants | Mexico | 0.0 /100 | #311 | Tragic 6.3% |
| Immigrants | Grenada | 0.0 /100 | #312 | Tragic 6.3% |
| Belizeans | 0.0 /100 | #313 | Tragic 6.3% |
| Immigrants | Ecuador | 0.0 /100 | #314 | Tragic 6.4% |
| Pueblo | 0.0 /100 | #315 | Tragic 6.4% |
| Houma | 0.0 /100 | #316 | Tragic 6.4% |
Demographics Similar to Immigrants from Norway by Female Unemployment
In terms of female unemployment, the demographic groups most similar to Immigrants from Norway are Immigrants from Oceania (5.2%, a difference of 0.010%), Argentinean (5.2%, a difference of 0.020%), Immigrants from Argentina (5.2%, a difference of 0.060%), Immigrants from Jordan (5.1%, a difference of 0.10%), and Asian (5.2%, a difference of 0.10%).
| Demographics | Rating | Rank | Female Unemployment |
| Immigrants | Eastern Asia | 83.0 /100 | #139 | Excellent 5.1% |
| Immigrants | France | 82.7 /100 | #140 | Excellent 5.1% |
| Immigrants | Eastern Europe | 81.5 /100 | #141 | Excellent 5.1% |
| Palestinians | 80.8 /100 | #142 | Excellent 5.1% |
| Immigrants | Kazakhstan | 80.7 /100 | #143 | Excellent 5.1% |
| Immigrants | Jordan | 80.4 /100 | #144 | Excellent 5.1% |
| Immigrants | Oceania | 79.5 /100 | #145 | Good 5.2% |
| Immigrants | Norway | 79.4 /100 | #146 | Good 5.2% |
| Argentineans | 79.2 /100 | #147 | Good 5.2% |
| Immigrants | Argentina | 78.7 /100 | #148 | Good 5.2% |
| Asians | 78.3 /100 | #149 | Good 5.2% |
| Egyptians | 78.3 /100 | #150 | Good 5.2% |
| Immigrants | China | 75.9 /100 | #151 | Good 5.2% |
| Immigrants | Italy | 75.0 /100 | #152 | Good 5.2% |
| Immigrants | Greece | 74.9 /100 | #153 | Good 5.2% |