Ecuadorian vs Arab Female Unemployment
COMPARE
Ecuadorian
Arab
Female Unemployment
Female Unemployment Comparison
Ecuadorians
Arabs
6.3%
FEMALE UNEMPLOYMENT
0.0/ 100
METRIC RATING
309th/ 347
METRIC RANK
5.3%
FEMALE UNEMPLOYMENT
27.7/ 100
METRIC RATING
193rd/ 347
METRIC RANK
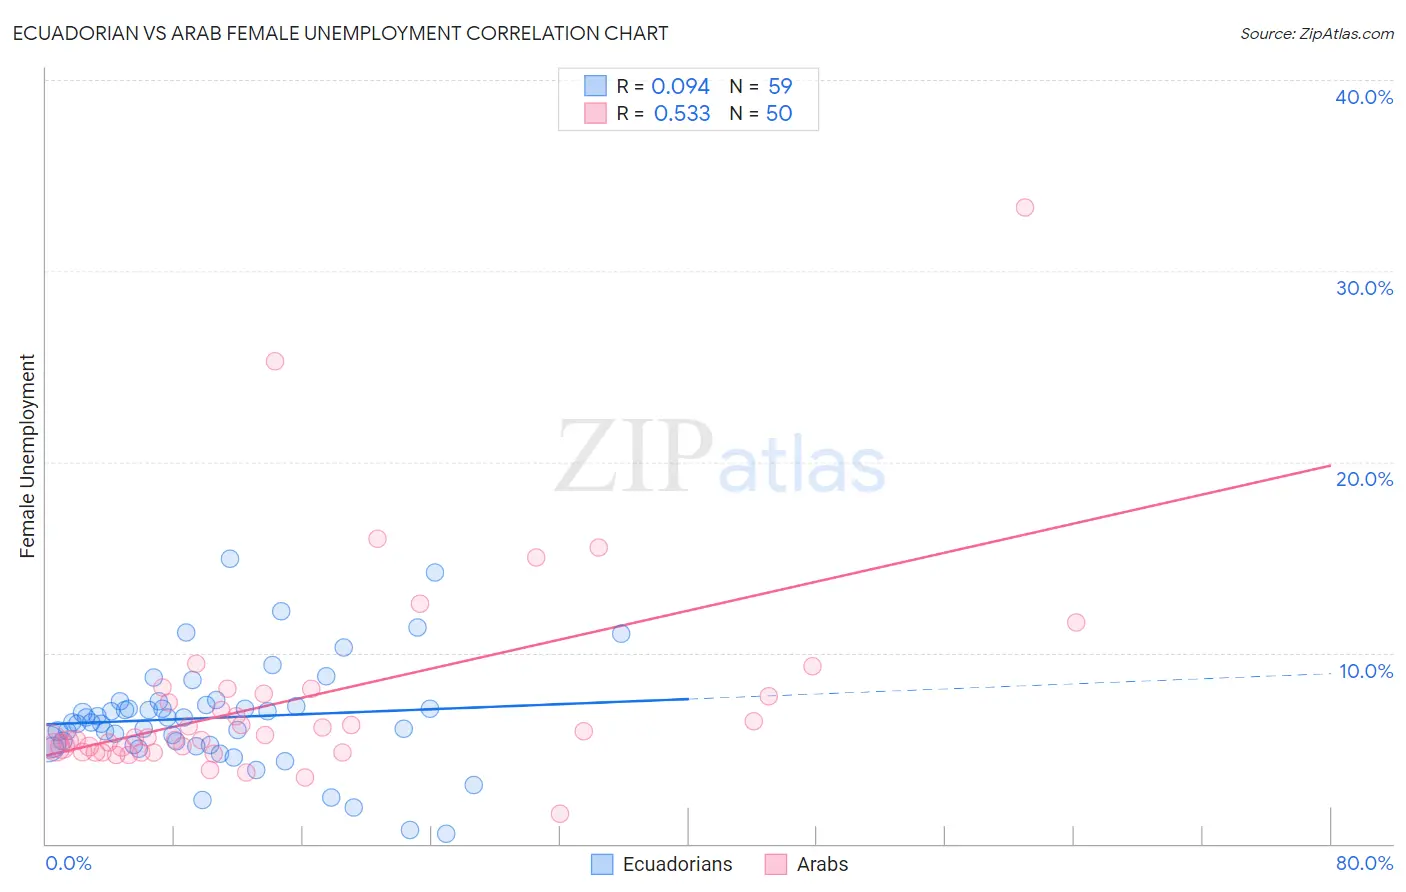
Ecuadorian vs Arab Female Unemployment Correlation Chart
The statistical analysis conducted on geographies consisting of 317,059,726 people shows a slight positive correlation between the proportion of Ecuadorians and unemploymnet rate among females in the United States with a correlation coefficient (R) of 0.094 and weighted average of 6.3%. Similarly, the statistical analysis conducted on geographies consisting of 483,183,943 people shows a substantial positive correlation between the proportion of Arabs and unemploymnet rate among females in the United States with a correlation coefficient (R) of 0.533 and weighted average of 5.3%, a difference of 17.5%.
Female Unemployment Correlation Summary
| Measurement | Ecuadorian | Arab |
| Minimum | 0.50% | 1.6% |
| Maximum | 14.9% | 33.3% |
| Range | 14.4% | 31.7% |
| Mean | 6.6% | 7.5% |
| Median | 6.4% | 5.6% |
| Interquartile 25% (IQ1) | 5.2% | 4.8% |
| Interquartile 75% (IQ3) | 7.2% | 7.8% |
| Interquartile Range (IQR) | 2.0% | 3.0% |
| Standard Deviation (Sample) | 2.8% | 5.4% |
| Standard Deviation (Population) | 2.7% | 5.4% |
Similar Demographics by Female Unemployment
Demographics Similar to Ecuadorians by Female Unemployment
In terms of female unemployment, the demographic groups most similar to Ecuadorians are Central American Indian (6.3%, a difference of 0.41%), Immigrants from Mexico (6.3%, a difference of 0.54%), Hispanic or Latino (6.2%, a difference of 0.58%), Shoshone (6.2%, a difference of 0.64%), and Immigrants from Central America (6.2%, a difference of 0.66%).
| Demographics | Rating | Rank | Female Unemployment |
| U.S. Virgin Islanders | 0.0 /100 | #302 | Tragic 6.2% |
| Barbadians | 0.0 /100 | #303 | Tragic 6.2% |
| Immigrants | Jamaica | 0.0 /100 | #304 | Tragic 6.2% |
| Spanish American Indians | 0.0 /100 | #305 | Tragic 6.2% |
| Immigrants | Central America | 0.0 /100 | #306 | Tragic 6.2% |
| Shoshone | 0.0 /100 | #307 | Tragic 6.2% |
| Hispanics or Latinos | 0.0 /100 | #308 | Tragic 6.2% |
| Ecuadorians | 0.0 /100 | #309 | Tragic 6.3% |
| Central American Indians | 0.0 /100 | #310 | Tragic 6.3% |
| Immigrants | Mexico | 0.0 /100 | #311 | Tragic 6.3% |
| Immigrants | Grenada | 0.0 /100 | #312 | Tragic 6.3% |
| Belizeans | 0.0 /100 | #313 | Tragic 6.3% |
| Immigrants | Ecuador | 0.0 /100 | #314 | Tragic 6.4% |
| Pueblo | 0.0 /100 | #315 | Tragic 6.4% |
| Houma | 0.0 /100 | #316 | Tragic 6.4% |
Demographics Similar to Arabs by Female Unemployment
In terms of female unemployment, the demographic groups most similar to Arabs are Colombian (5.3%, a difference of 0.050%), Portuguese (5.3%, a difference of 0.070%), Immigrants from Colombia (5.3%, a difference of 0.11%), Spaniard (5.3%, a difference of 0.19%), and Cherokee (5.3%, a difference of 0.23%).
| Demographics | Rating | Rank | Female Unemployment |
| Immigrants | Belarus | 39.4 /100 | #186 | Fair 5.3% |
| Immigrants | Albania | 35.4 /100 | #187 | Fair 5.3% |
| Afghans | 33.9 /100 | #188 | Fair 5.3% |
| Costa Ricans | 33.8 /100 | #189 | Fair 5.3% |
| Ugandans | 31.2 /100 | #190 | Fair 5.3% |
| Cherokee | 30.8 /100 | #191 | Fair 5.3% |
| Portuguese | 28.6 /100 | #192 | Fair 5.3% |
| Arabs | 27.7 /100 | #193 | Fair 5.3% |
| Colombians | 27.0 /100 | #194 | Fair 5.3% |
| Immigrants | Colombia | 26.2 /100 | #195 | Fair 5.3% |
| Spaniards | 25.2 /100 | #196 | Fair 5.3% |
| Alsatians | 23.9 /100 | #197 | Fair 5.3% |
| Tsimshian | 23.1 /100 | #198 | Fair 5.4% |
| Hawaiians | 22.2 /100 | #199 | Fair 5.4% |
| Soviet Union | 21.7 /100 | #200 | Fair 5.4% |