Yakama vs Immigrants from Norway Female Unemployment
COMPARE
Yakama
Immigrants from Norway
Female Unemployment
Female Unemployment Comparison
Yakama
Immigrants from Norway
6.7%
FEMALE UNEMPLOYMENT
0.0/ 100
METRIC RATING
330th/ 347
METRIC RANK
5.2%
FEMALE UNEMPLOYMENT
79.4/ 100
METRIC RATING
146th/ 347
METRIC RANK
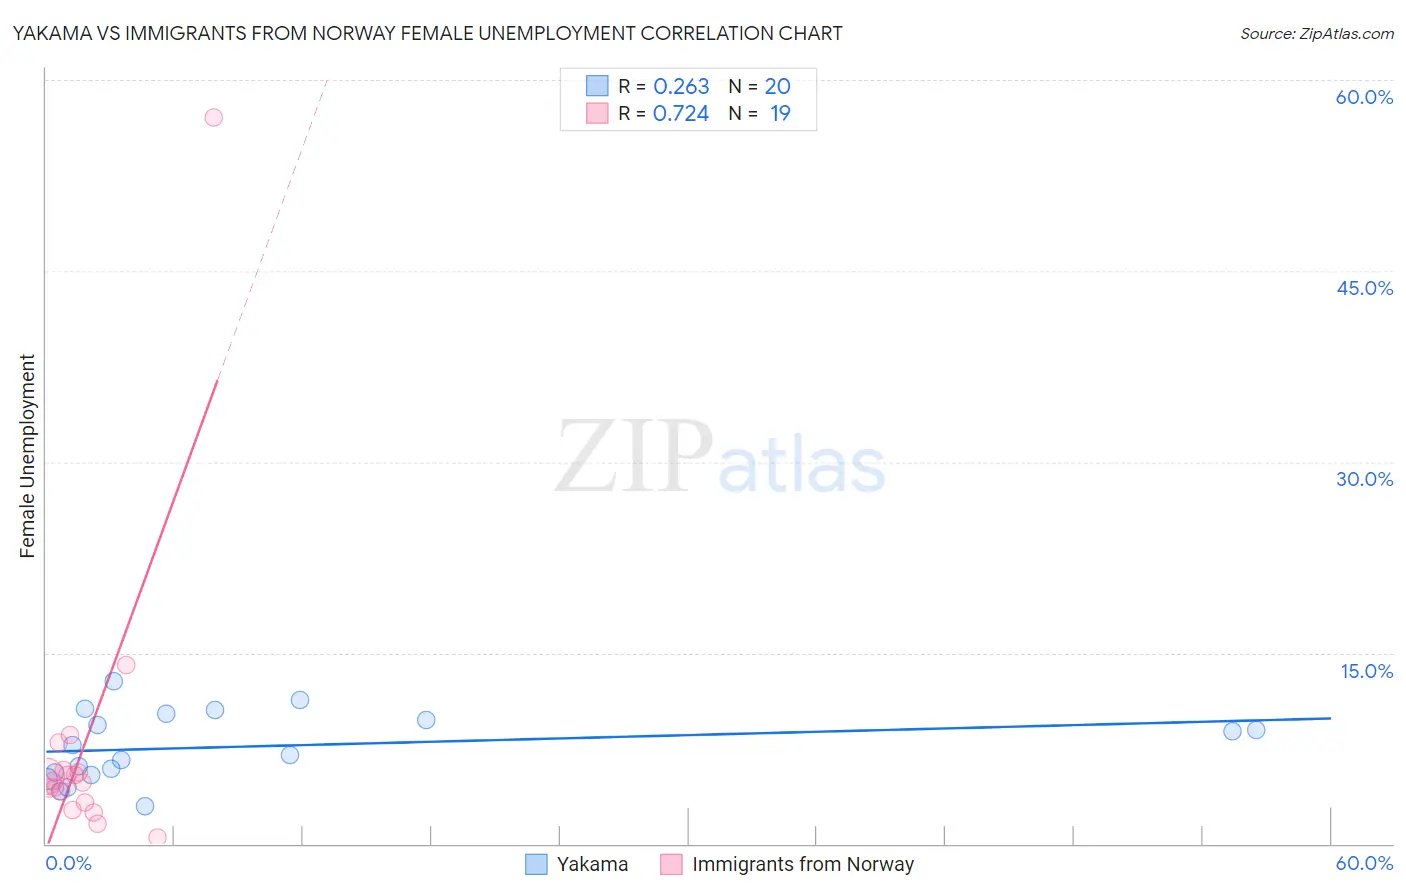
Yakama vs Immigrants from Norway Female Unemployment Correlation Chart
The statistical analysis conducted on geographies consisting of 19,884,840 people shows a weak positive correlation between the proportion of Yakama and unemploymnet rate among females in the United States with a correlation coefficient (R) of 0.263 and weighted average of 6.7%. Similarly, the statistical analysis conducted on geographies consisting of 116,500,173 people shows a strong positive correlation between the proportion of Immigrants from Norway and unemploymnet rate among females in the United States with a correlation coefficient (R) of 0.724 and weighted average of 5.2%, a difference of 30.5%.
Female Unemployment Correlation Summary
| Measurement | Yakama | Immigrants from Norway |
| Minimum | 2.9% | 0.50% |
| Maximum | 12.8% | 57.1% |
| Range | 9.9% | 56.6% |
| Mean | 7.6% | 7.8% |
| Median | 7.4% | 4.9% |
| Interquartile 25% (IQ1) | 5.5% | 3.2% |
| Interquartile 75% (IQ3) | 9.9% | 5.8% |
| Interquartile Range (IQR) | 4.5% | 2.6% |
| Standard Deviation (Sample) | 2.7% | 12.3% |
| Standard Deviation (Population) | 2.7% | 12.0% |
Similar Demographics by Female Unemployment
Demographics Similar to Yakama by Female Unemployment
In terms of female unemployment, the demographic groups most similar to Yakama are Immigrants from Guyana (6.7%, a difference of 0.57%), Guyanese (6.7%, a difference of 0.94%), Paiute (6.8%, a difference of 1.1%), Alaska Native (6.6%, a difference of 1.4%), and Native/Alaskan (6.6%, a difference of 1.5%).
| Demographics | Rating | Rank | Female Unemployment |
| Immigrants | Belize | 0.0 /100 | #323 | Tragic 6.5% |
| Cheyenne | 0.0 /100 | #324 | Tragic 6.6% |
| Apache | 0.0 /100 | #325 | Tragic 6.6% |
| Natives/Alaskans | 0.0 /100 | #326 | Tragic 6.6% |
| Alaska Natives | 0.0 /100 | #327 | Tragic 6.6% |
| Guyanese | 0.0 /100 | #328 | Tragic 6.7% |
| Immigrants | Guyana | 0.0 /100 | #329 | Tragic 6.7% |
| Yakama | 0.0 /100 | #330 | Tragic 6.7% |
| Paiute | 0.0 /100 | #331 | Tragic 6.8% |
| Sioux | 0.0 /100 | #332 | Tragic 7.0% |
| Menominee | 0.0 /100 | #333 | Tragic 7.0% |
| Immigrants | Armenia | 0.0 /100 | #334 | Tragic 7.1% |
| Dominicans | 0.0 /100 | #335 | Tragic 7.2% |
| Immigrants | Dominican Republic | 0.0 /100 | #336 | Tragic 7.2% |
| Navajo | 0.0 /100 | #337 | Tragic 7.3% |
Demographics Similar to Immigrants from Norway by Female Unemployment
In terms of female unemployment, the demographic groups most similar to Immigrants from Norway are Immigrants from Oceania (5.2%, a difference of 0.010%), Argentinean (5.2%, a difference of 0.020%), Immigrants from Argentina (5.2%, a difference of 0.060%), Immigrants from Jordan (5.1%, a difference of 0.10%), and Asian (5.2%, a difference of 0.10%).
| Demographics | Rating | Rank | Female Unemployment |
| Immigrants | Eastern Asia | 83.0 /100 | #139 | Excellent 5.1% |
| Immigrants | France | 82.7 /100 | #140 | Excellent 5.1% |
| Immigrants | Eastern Europe | 81.5 /100 | #141 | Excellent 5.1% |
| Palestinians | 80.8 /100 | #142 | Excellent 5.1% |
| Immigrants | Kazakhstan | 80.7 /100 | #143 | Excellent 5.1% |
| Immigrants | Jordan | 80.4 /100 | #144 | Excellent 5.1% |
| Immigrants | Oceania | 79.5 /100 | #145 | Good 5.2% |
| Immigrants | Norway | 79.4 /100 | #146 | Good 5.2% |
| Argentineans | 79.2 /100 | #147 | Good 5.2% |
| Immigrants | Argentina | 78.7 /100 | #148 | Good 5.2% |
| Asians | 78.3 /100 | #149 | Good 5.2% |
| Egyptians | 78.3 /100 | #150 | Good 5.2% |
| Immigrants | China | 75.9 /100 | #151 | Good 5.2% |
| Immigrants | Italy | 75.0 /100 | #152 | Good 5.2% |
| Immigrants | Greece | 74.9 /100 | #153 | Good 5.2% |