Romanian vs Immigrants from Norway Female Unemployment
COMPARE
Romanian
Immigrants from Norway
Female Unemployment
Female Unemployment Comparison
Romanians
Immigrants from Norway
5.0%
FEMALE UNEMPLOYMENT
95.9/ 100
METRIC RATING
92nd/ 347
METRIC RANK
5.2%
FEMALE UNEMPLOYMENT
79.4/ 100
METRIC RATING
146th/ 347
METRIC RANK
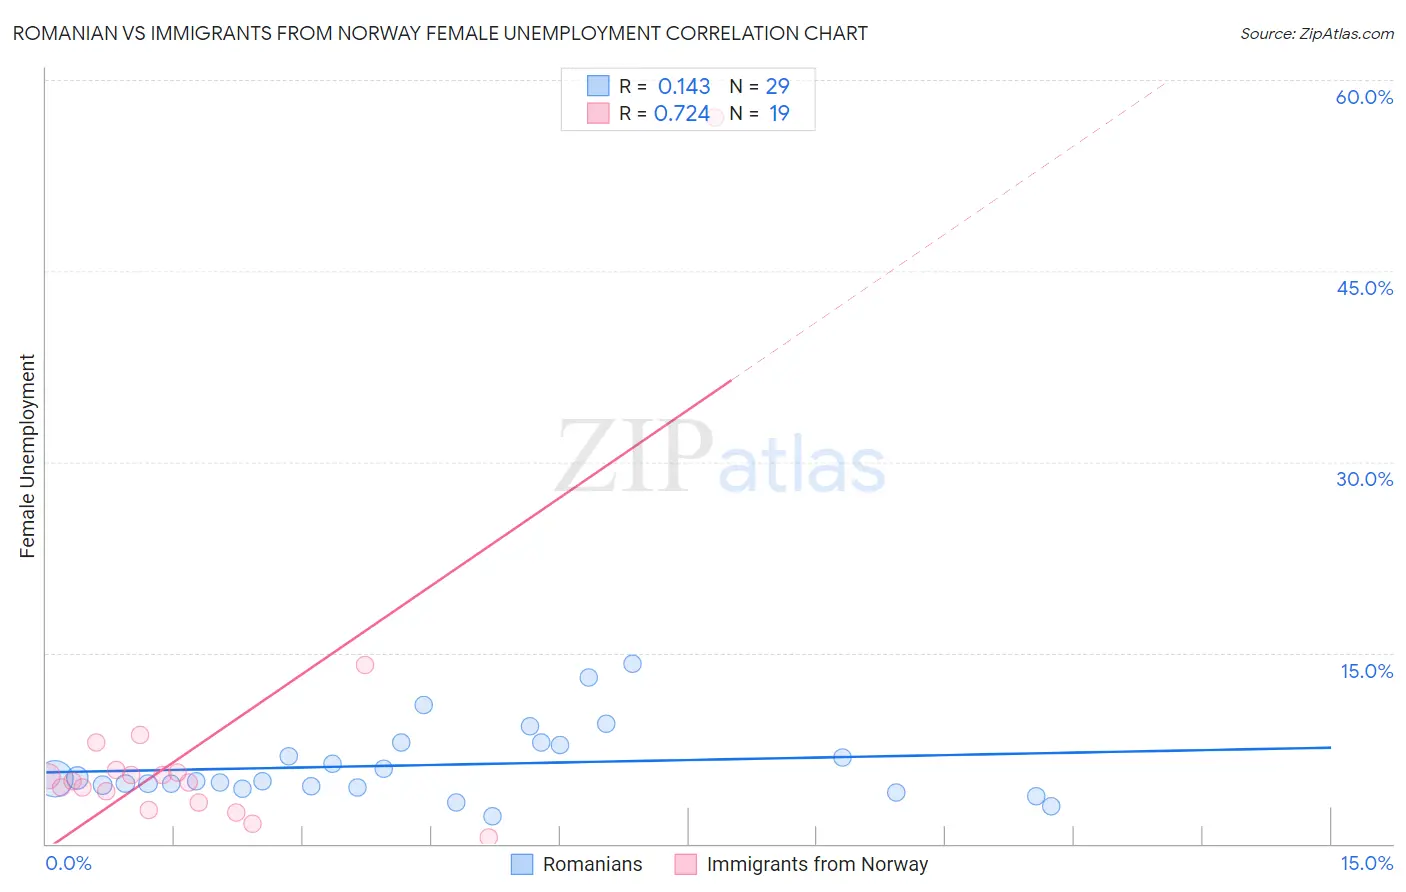
Romanian vs Immigrants from Norway Female Unemployment Correlation Chart
The statistical analysis conducted on geographies consisting of 376,152,929 people shows a poor positive correlation between the proportion of Romanians and unemploymnet rate among females in the United States with a correlation coefficient (R) of 0.143 and weighted average of 5.0%. Similarly, the statistical analysis conducted on geographies consisting of 116,500,173 people shows a strong positive correlation between the proportion of Immigrants from Norway and unemploymnet rate among females in the United States with a correlation coefficient (R) of 0.724 and weighted average of 5.2%, a difference of 2.9%.
Female Unemployment Correlation Summary
| Measurement | Romanian | Immigrants from Norway |
| Minimum | 2.1% | 0.50% |
| Maximum | 14.1% | 57.1% |
| Range | 12.0% | 56.6% |
| Mean | 6.2% | 7.8% |
| Median | 5.0% | 4.9% |
| Interquartile 25% (IQ1) | 4.5% | 3.2% |
| Interquartile 75% (IQ3) | 7.9% | 5.8% |
| Interquartile Range (IQR) | 3.4% | 2.6% |
| Standard Deviation (Sample) | 2.9% | 12.3% |
| Standard Deviation (Population) | 2.8% | 12.0% |
Similar Demographics by Female Unemployment
Demographics Similar to Romanians by Female Unemployment
In terms of female unemployment, the demographic groups most similar to Romanians are Immigrants from Japan (5.0%, a difference of 0.030%), Immigrants from Austria (5.0%, a difference of 0.080%), Immigrants from Malaysia (5.0%, a difference of 0.10%), Burmese (5.0%, a difference of 0.12%), and Immigrants from Sweden (5.0%, a difference of 0.14%).
| Demographics | Rating | Rank | Female Unemployment |
| Ukrainians | 97.1 /100 | #85 | Exceptional 5.0% |
| Bolivians | 97.1 /100 | #86 | Exceptional 5.0% |
| Venezuelans | 96.9 /100 | #87 | Exceptional 5.0% |
| Immigrants | Sudan | 96.7 /100 | #88 | Exceptional 5.0% |
| Immigrants | Taiwan | 96.6 /100 | #89 | Exceptional 5.0% |
| Immigrants | Sweden | 96.3 /100 | #90 | Exceptional 5.0% |
| Immigrants | Japan | 96.0 /100 | #91 | Exceptional 5.0% |
| Romanians | 95.9 /100 | #92 | Exceptional 5.0% |
| Immigrants | Austria | 95.7 /100 | #93 | Exceptional 5.0% |
| Immigrants | Malaysia | 95.7 /100 | #94 | Exceptional 5.0% |
| Burmese | 95.6 /100 | #95 | Exceptional 5.0% |
| Immigrants | South Central Asia | 95.5 /100 | #96 | Exceptional 5.0% |
| Immigrants | Somalia | 95.2 /100 | #97 | Exceptional 5.0% |
| Immigrants | Kuwait | 95.2 /100 | #98 | Exceptional 5.0% |
| Immigrants | Zaire | 95.2 /100 | #99 | Exceptional 5.0% |
Demographics Similar to Immigrants from Norway by Female Unemployment
In terms of female unemployment, the demographic groups most similar to Immigrants from Norway are Immigrants from Oceania (5.2%, a difference of 0.010%), Argentinean (5.2%, a difference of 0.020%), Immigrants from Argentina (5.2%, a difference of 0.060%), Immigrants from Jordan (5.1%, a difference of 0.10%), and Asian (5.2%, a difference of 0.10%).
| Demographics | Rating | Rank | Female Unemployment |
| Immigrants | Eastern Asia | 83.0 /100 | #139 | Excellent 5.1% |
| Immigrants | France | 82.7 /100 | #140 | Excellent 5.1% |
| Immigrants | Eastern Europe | 81.5 /100 | #141 | Excellent 5.1% |
| Palestinians | 80.8 /100 | #142 | Excellent 5.1% |
| Immigrants | Kazakhstan | 80.7 /100 | #143 | Excellent 5.1% |
| Immigrants | Jordan | 80.4 /100 | #144 | Excellent 5.1% |
| Immigrants | Oceania | 79.5 /100 | #145 | Good 5.2% |
| Immigrants | Norway | 79.4 /100 | #146 | Good 5.2% |
| Argentineans | 79.2 /100 | #147 | Good 5.2% |
| Immigrants | Argentina | 78.7 /100 | #148 | Good 5.2% |
| Asians | 78.3 /100 | #149 | Good 5.2% |
| Egyptians | 78.3 /100 | #150 | Good 5.2% |
| Immigrants | China | 75.9 /100 | #151 | Good 5.2% |
| Immigrants | Italy | 75.0 /100 | #152 | Good 5.2% |
| Immigrants | Greece | 74.9 /100 | #153 | Good 5.2% |