Paraguayan vs Immigrants from Korea Female Unemployment
COMPARE
Paraguayan
Immigrants from Korea
Female Unemployment
Female Unemployment Comparison
Paraguayans
Immigrants from Korea
5.1%
FEMALE UNEMPLOYMENT
93.2/ 100
METRIC RATING
106th/ 347
METRIC RANK
5.1%
FEMALE UNEMPLOYMENT
86.3/ 100
METRIC RATING
126th/ 347
METRIC RANK
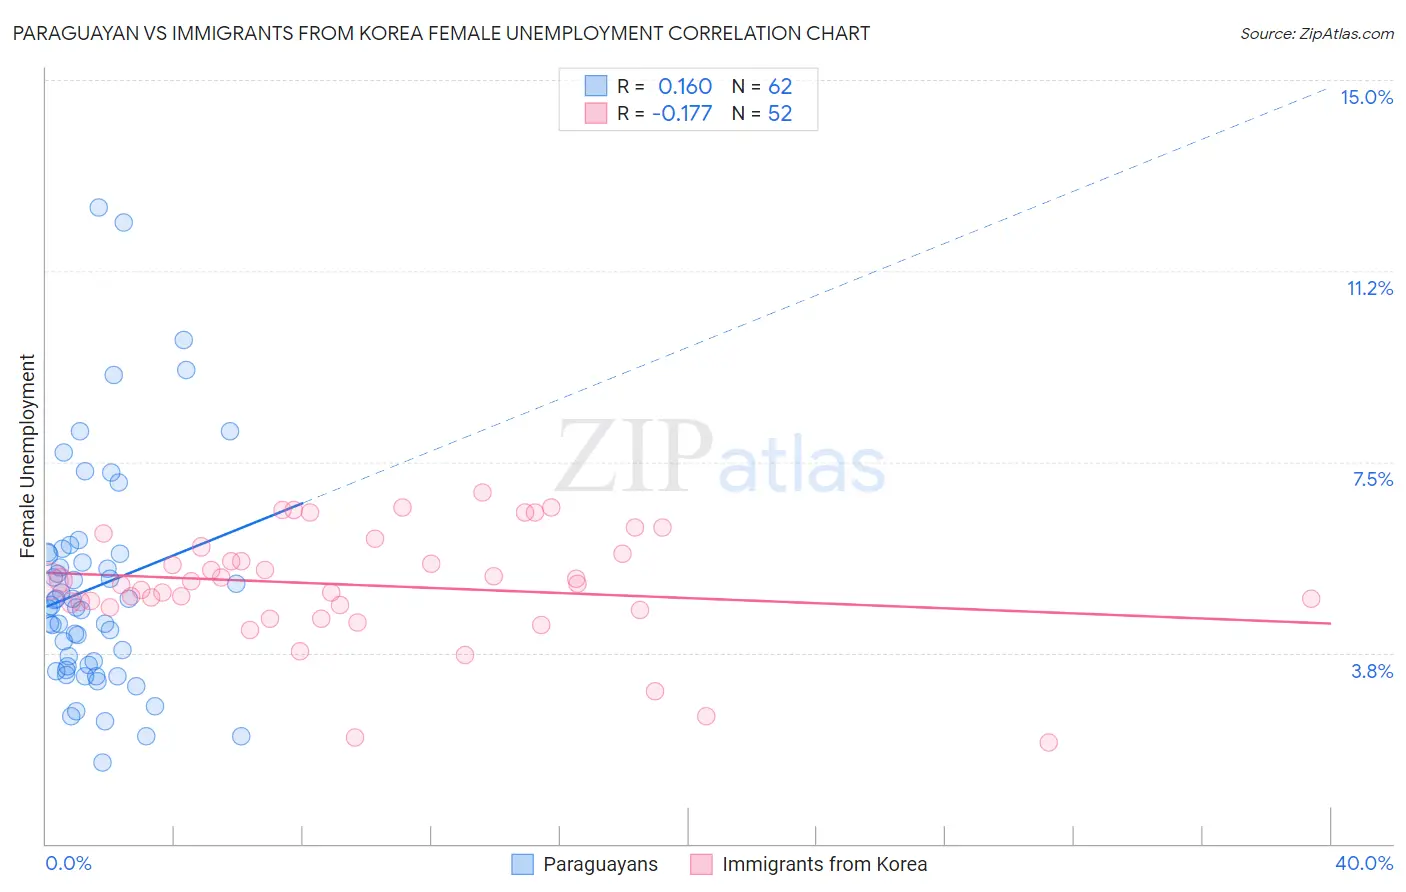
Paraguayan vs Immigrants from Korea Female Unemployment Correlation Chart
The statistical analysis conducted on geographies consisting of 95,037,971 people shows a poor positive correlation between the proportion of Paraguayans and unemploymnet rate among females in the United States with a correlation coefficient (R) of 0.160 and weighted average of 5.1%. Similarly, the statistical analysis conducted on geographies consisting of 414,293,995 people shows a poor negative correlation between the proportion of Immigrants from Korea and unemploymnet rate among females in the United States with a correlation coefficient (R) of -0.177 and weighted average of 5.1%, a difference of 1.2%.
Female Unemployment Correlation Summary
| Measurement | Paraguayan | Immigrants from Korea |
| Minimum | 1.6% | 2.0% |
| Maximum | 12.5% | 6.9% |
| Range | 10.9% | 4.9% |
| Mean | 5.0% | 5.1% |
| Median | 4.7% | 5.1% |
| Interquartile 25% (IQ1) | 3.5% | 4.7% |
| Interquartile 75% (IQ3) | 5.7% | 5.8% |
| Interquartile Range (IQR) | 2.2% | 1.1% |
| Standard Deviation (Sample) | 2.2% | 1.1% |
| Standard Deviation (Population) | 2.2% | 1.1% |
Demographics Similar to Paraguayans and Immigrants from Korea by Female Unemployment
In terms of female unemployment, the demographic groups most similar to Paraguayans are Immigrants from Switzerland (5.1%, a difference of 0.030%), Puget Sound Salish (5.1%, a difference of 0.050%), Immigrants from Eastern Africa (5.1%, a difference of 0.090%), Macedonian (5.1%, a difference of 0.19%), and Immigrants from Burma/Myanmar (5.1%, a difference of 0.22%). Similarly, the demographic groups most similar to Immigrants from Korea are Basque (5.1%, a difference of 0.020%), Immigrants from Europe (5.1%, a difference of 0.12%), Immigrants from Germany (5.1%, a difference of 0.17%), Immigrants from South Africa (5.1%, a difference of 0.17%), and Immigrants from Romania (5.1%, a difference of 0.25%).
| Demographics | Rating | Rank | Female Unemployment |
| Paraguayans | 93.2 /100 | #106 | Exceptional 5.1% |
| Immigrants | Switzerland | 93.1 /100 | #107 | Exceptional 5.1% |
| Puget Sound Salish | 93.0 /100 | #108 | Exceptional 5.1% |
| Immigrants | Eastern Africa | 92.8 /100 | #109 | Exceptional 5.1% |
| Macedonians | 92.4 /100 | #110 | Exceptional 5.1% |
| Immigrants | Burma/Myanmar | 92.3 /100 | #111 | Exceptional 5.1% |
| Estonians | 92.1 /100 | #112 | Exceptional 5.1% |
| Immigrants | Saudi Arabia | 91.2 /100 | #113 | Exceptional 5.1% |
| Immigrants | Turkey | 91.0 /100 | #114 | Exceptional 5.1% |
| Lebanese | 91.0 /100 | #115 | Exceptional 5.1% |
| Americans | 90.5 /100 | #116 | Exceptional 5.1% |
| Jordanians | 90.3 /100 | #117 | Exceptional 5.1% |
| Immigrants | Croatia | 89.9 /100 | #118 | Excellent 5.1% |
| Immigrants | North Macedonia | 88.3 /100 | #119 | Excellent 5.1% |
| Immigrants | Romania | 88.1 /100 | #120 | Excellent 5.1% |
| Immigrants | Western Europe | 88.1 /100 | #121 | Excellent 5.1% |
| Immigrants | Germany | 87.6 /100 | #122 | Excellent 5.1% |
| Immigrants | South Africa | 87.6 /100 | #123 | Excellent 5.1% |
| Immigrants | Europe | 87.2 /100 | #124 | Excellent 5.1% |
| Basques | 86.5 /100 | #125 | Excellent 5.1% |
| Immigrants | Korea | 86.3 /100 | #126 | Excellent 5.1% |