Canadian vs Dutch West Indian Male Unemployment
COMPARE
Canadian
Dutch West Indian
Male Unemployment
Male Unemployment Comparison
Canadians
Dutch West Indians
5.1%
MALE UNEMPLOYMENT
94.1/ 100
METRIC RATING
94th/ 347
METRIC RANK
5.8%
MALE UNEMPLOYMENT
0.1/ 100
METRIC RATING
258th/ 347
METRIC RANK
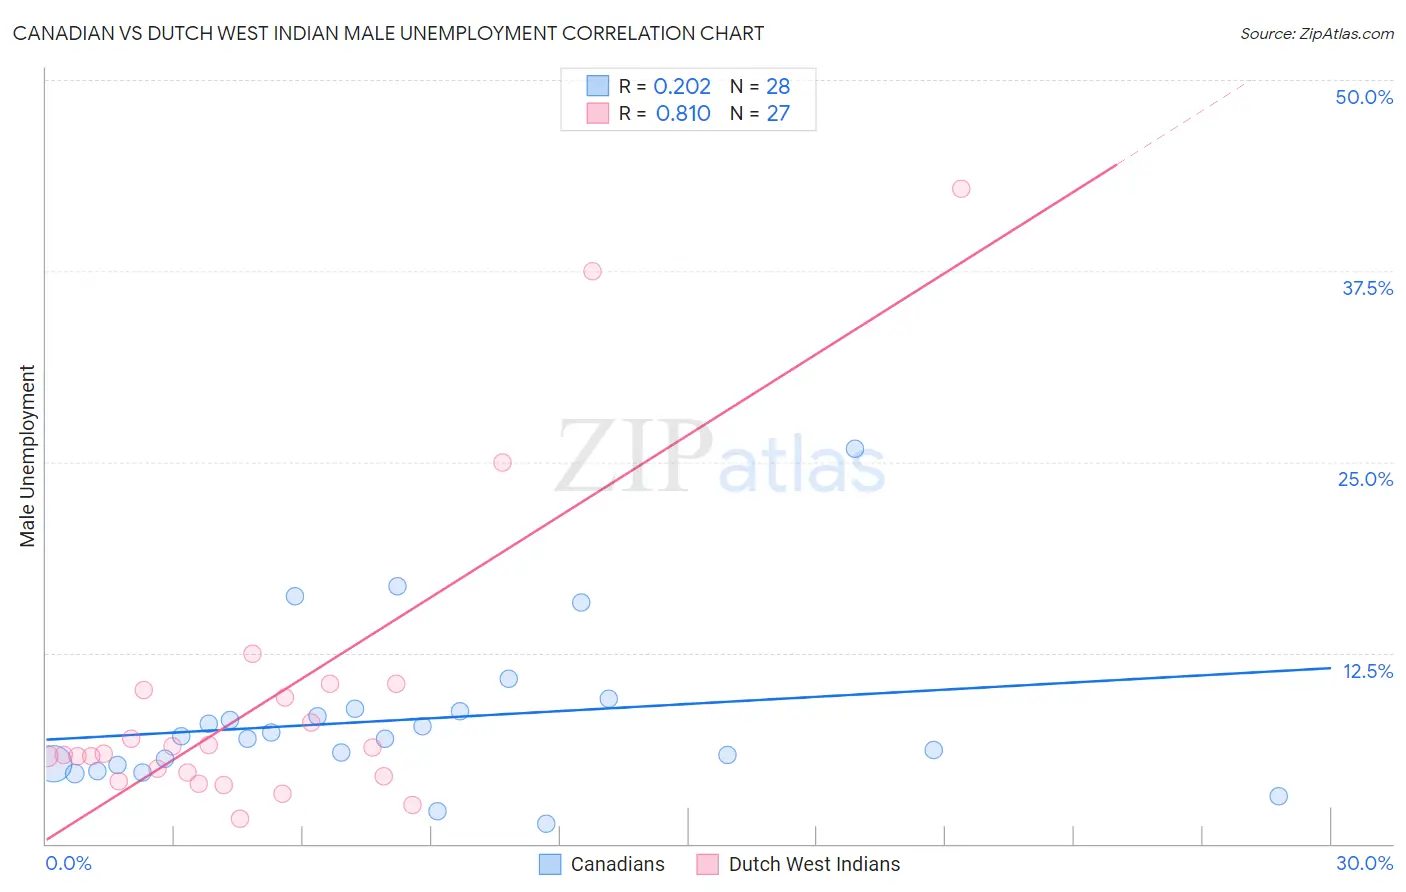
Canadian vs Dutch West Indian Male Unemployment Correlation Chart
The statistical analysis conducted on geographies consisting of 434,702,857 people shows a weak positive correlation between the proportion of Canadians and unemployment rate among males in the United States with a correlation coefficient (R) of 0.202 and weighted average of 5.1%. Similarly, the statistical analysis conducted on geographies consisting of 85,545,191 people shows a very strong positive correlation between the proportion of Dutch West Indians and unemployment rate among males in the United States with a correlation coefficient (R) of 0.810 and weighted average of 5.8%, a difference of 14.3%.
Male Unemployment Correlation Summary
| Measurement | Canadian | Dutch West Indian |
| Minimum | 1.3% | 1.6% |
| Maximum | 25.9% | 42.9% |
| Range | 24.6% | 41.3% |
| Mean | 8.1% | 9.4% |
| Median | 7.0% | 5.9% |
| Interquartile 25% (IQ1) | 5.2% | 4.4% |
| Interquartile 75% (IQ3) | 8.8% | 10.1% |
| Interquartile Range (IQR) | 3.6% | 5.7% |
| Standard Deviation (Sample) | 5.1% | 9.9% |
| Standard Deviation (Population) | 5.1% | 9.8% |
Similar Demographics by Male Unemployment
Demographics Similar to Canadians by Male Unemployment
In terms of male unemployment, the demographic groups most similar to Canadians are Slavic (5.1%, a difference of 0.050%), Immigrants from Serbia (5.1%, a difference of 0.050%), Italian (5.1%, a difference of 0.080%), Immigrants from Turkey (5.1%, a difference of 0.10%), and Asian (5.1%, a difference of 0.10%).
| Demographics | Rating | Rank | Male Unemployment |
| Immigrants | Romania | 95.4 /100 | #87 | Exceptional 5.1% |
| Immigrants | Sri Lanka | 94.9 /100 | #88 | Exceptional 5.1% |
| Immigrants | Australia | 94.7 /100 | #89 | Exceptional 5.1% |
| Okinawans | 94.7 /100 | #90 | Exceptional 5.1% |
| Immigrants | Turkey | 94.4 /100 | #91 | Exceptional 5.1% |
| Slavs | 94.2 /100 | #92 | Exceptional 5.1% |
| Immigrants | Serbia | 94.2 /100 | #93 | Exceptional 5.1% |
| Canadians | 94.1 /100 | #94 | Exceptional 5.1% |
| Italians | 93.8 /100 | #95 | Exceptional 5.1% |
| Asians | 93.7 /100 | #96 | Exceptional 5.1% |
| Immigrants | Spain | 93.4 /100 | #97 | Exceptional 5.1% |
| Immigrants | Kuwait | 93.3 /100 | #98 | Exceptional 5.1% |
| Uruguayans | 93.0 /100 | #99 | Exceptional 5.1% |
| Russians | 92.9 /100 | #100 | Exceptional 5.1% |
| German Russians | 92.7 /100 | #101 | Exceptional 5.1% |
Demographics Similar to Dutch West Indians by Male Unemployment
In terms of male unemployment, the demographic groups most similar to Dutch West Indians are Hispanic or Latino (5.8%, a difference of 0.14%), Cajun (5.8%, a difference of 0.15%), Immigrants from Central America (5.8%, a difference of 0.21%), Comanche (5.8%, a difference of 0.30%), and Kiowa (5.8%, a difference of 0.38%).
| Demographics | Rating | Rank | Male Unemployment |
| Spanish Americans | 0.3 /100 | #251 | Tragic 5.7% |
| Mexicans | 0.2 /100 | #252 | Tragic 5.8% |
| Mexican American Indians | 0.2 /100 | #253 | Tragic 5.8% |
| Japanese | 0.2 /100 | #254 | Tragic 5.8% |
| Kiowa | 0.2 /100 | #255 | Tragic 5.8% |
| Comanche | 0.2 /100 | #256 | Tragic 5.8% |
| Hispanics or Latinos | 0.1 /100 | #257 | Tragic 5.8% |
| Dutch West Indians | 0.1 /100 | #258 | Tragic 5.8% |
| Cajuns | 0.1 /100 | #259 | Tragic 5.8% |
| Immigrants | Central America | 0.1 /100 | #260 | Tragic 5.8% |
| Liberians | 0.1 /100 | #261 | Tragic 5.8% |
| Immigrants | Portugal | 0.1 /100 | #262 | Tragic 5.9% |
| Immigrants | Latin America | 0.1 /100 | #263 | Tragic 5.9% |
| Immigrants | Mexico | 0.0 /100 | #264 | Tragic 5.9% |
| French American Indians | 0.0 /100 | #265 | Tragic 5.9% |