Canadian vs French Male Unemployment
COMPARE
Canadian
French
Male Unemployment
Male Unemployment Comparison
Canadians
French
5.1%
MALE UNEMPLOYMENT
94.1/ 100
METRIC RATING
94th/ 347
METRIC RANK
5.0%
MALE UNEMPLOYMENT
96.2/ 100
METRIC RATING
81st/ 347
METRIC RANK
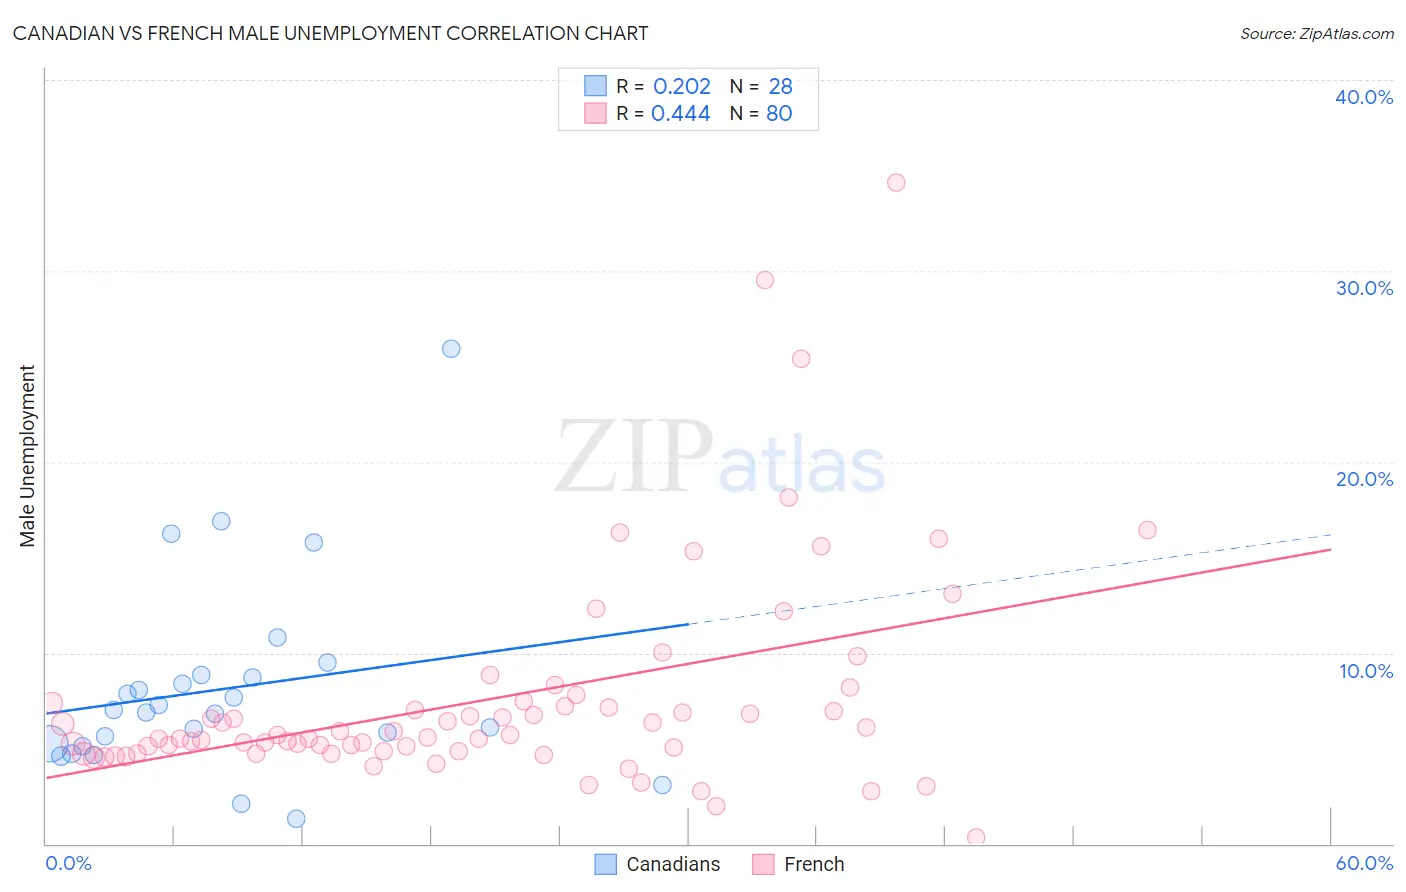
Canadian vs French Male Unemployment Correlation Chart
The statistical analysis conducted on geographies consisting of 434,702,857 people shows a weak positive correlation between the proportion of Canadians and unemployment rate among males in the United States with a correlation coefficient (R) of 0.202 and weighted average of 5.1%. Similarly, the statistical analysis conducted on geographies consisting of 561,355,143 people shows a moderate positive correlation between the proportion of French and unemployment rate among males in the United States with a correlation coefficient (R) of 0.444 and weighted average of 5.0%, a difference of 0.73%.
Male Unemployment Correlation Summary
| Measurement | Canadian | French |
| Minimum | 1.3% | 0.30% |
| Maximum | 25.9% | 34.6% |
| Range | 24.6% | 34.3% |
| Mean | 8.1% | 7.6% |
| Median | 7.0% | 5.6% |
| Interquartile 25% (IQ1) | 5.2% | 4.9% |
| Interquartile 75% (IQ3) | 8.8% | 7.3% |
| Interquartile Range (IQR) | 3.6% | 2.4% |
| Standard Deviation (Sample) | 5.1% | 5.7% |
| Standard Deviation (Population) | 5.1% | 5.6% |
Demographics Similar to Canadians and French by Male Unemployment
In terms of male unemployment, the demographic groups most similar to Canadians are Slavic (5.1%, a difference of 0.050%), Immigrants from Serbia (5.1%, a difference of 0.050%), Italian (5.1%, a difference of 0.080%), Immigrants from Turkey (5.1%, a difference of 0.10%), and Asian (5.1%, a difference of 0.10%). Similarly, the demographic groups most similar to French are Argentinean (5.0%, a difference of 0.0%), Chilean (5.0%, a difference of 0.030%), South African (5.0%, a difference of 0.050%), Immigrants from Northern Europe (5.0%, a difference of 0.070%), and Iranian (5.0%, a difference of 0.080%).
| Demographics | Rating | Rank | Male Unemployment |
| Iranians | 96.4 /100 | #77 | Exceptional 5.0% |
| Immigrants | Northern Europe | 96.4 /100 | #78 | Exceptional 5.0% |
| South Africans | 96.4 /100 | #79 | Exceptional 5.0% |
| Argentineans | 96.2 /100 | #80 | Exceptional 5.0% |
| French | 96.2 /100 | #81 | Exceptional 5.0% |
| Chileans | 96.2 /100 | #82 | Exceptional 5.0% |
| Immigrants | Eritrea | 96.0 /100 | #83 | Exceptional 5.0% |
| Serbians | 95.7 /100 | #84 | Exceptional 5.1% |
| Immigrants | North Macedonia | 95.6 /100 | #85 | Exceptional 5.1% |
| Maltese | 95.5 /100 | #86 | Exceptional 5.1% |
| Immigrants | Romania | 95.4 /100 | #87 | Exceptional 5.1% |
| Immigrants | Sri Lanka | 94.9 /100 | #88 | Exceptional 5.1% |
| Immigrants | Australia | 94.7 /100 | #89 | Exceptional 5.1% |
| Okinawans | 94.7 /100 | #90 | Exceptional 5.1% |
| Immigrants | Turkey | 94.4 /100 | #91 | Exceptional 5.1% |
| Slavs | 94.2 /100 | #92 | Exceptional 5.1% |
| Immigrants | Serbia | 94.2 /100 | #93 | Exceptional 5.1% |
| Canadians | 94.1 /100 | #94 | Exceptional 5.1% |
| Italians | 93.8 /100 | #95 | Exceptional 5.1% |
| Asians | 93.7 /100 | #96 | Exceptional 5.1% |
| Immigrants | Spain | 93.4 /100 | #97 | Exceptional 5.1% |