Canadian vs Bermudan Male Unemployment
COMPARE
Canadian
Bermudan
Male Unemployment
Male Unemployment Comparison
Canadians
Bermudans
5.1%
MALE UNEMPLOYMENT
94.1/ 100
METRIC RATING
94th/ 347
METRIC RANK
5.9%
MALE UNEMPLOYMENT
0.0/ 100
METRIC RATING
268th/ 347
METRIC RANK
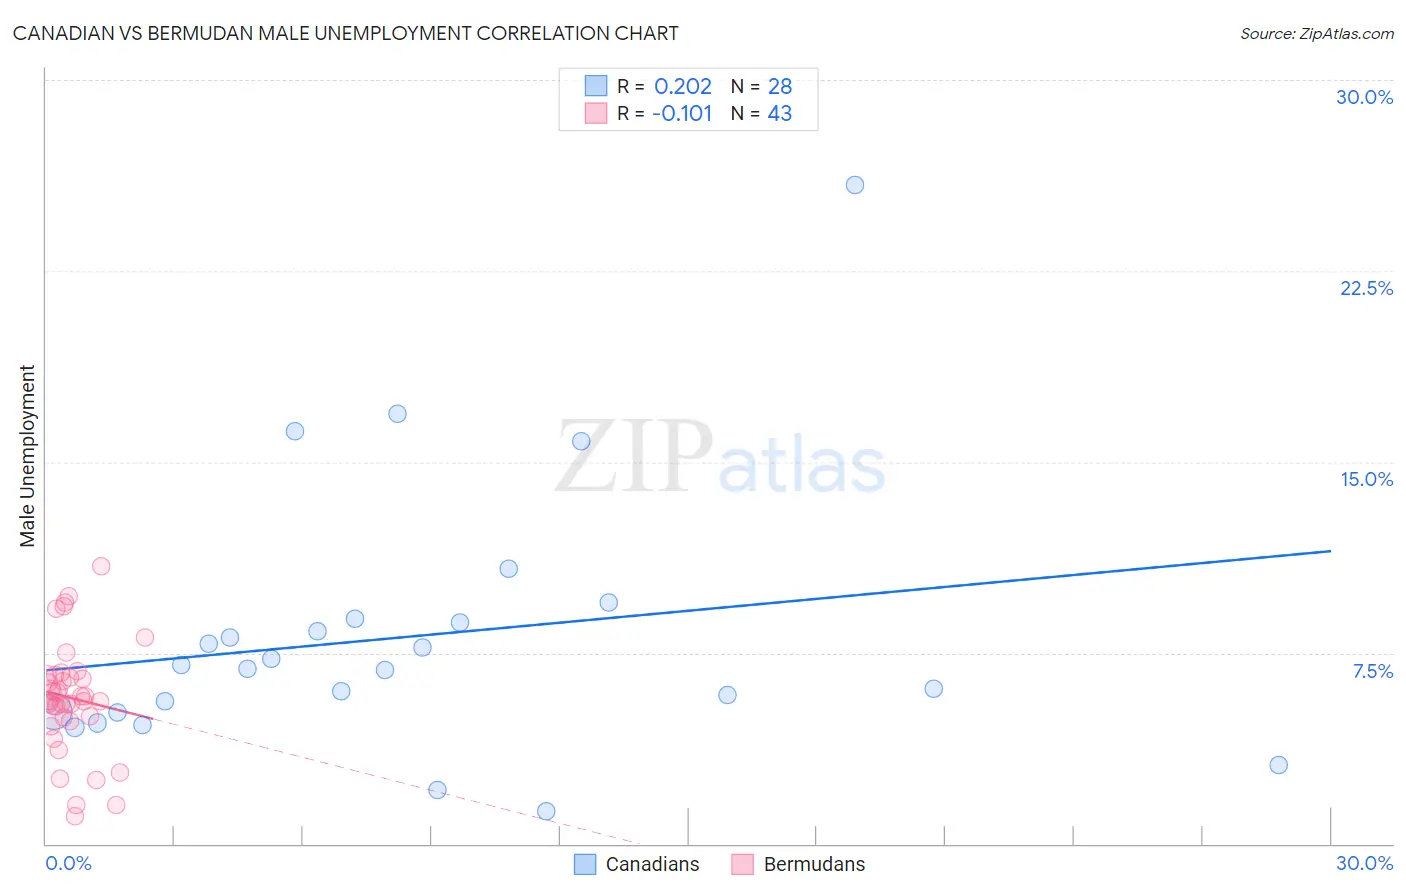
Canadian vs Bermudan Male Unemployment Correlation Chart
The statistical analysis conducted on geographies consisting of 434,702,857 people shows a weak positive correlation between the proportion of Canadians and unemployment rate among males in the United States with a correlation coefficient (R) of 0.202 and weighted average of 5.1%. Similarly, the statistical analysis conducted on geographies consisting of 55,661,801 people shows a poor negative correlation between the proportion of Bermudans and unemployment rate among males in the United States with a correlation coefficient (R) of -0.101 and weighted average of 5.9%, a difference of 16.8%.
Male Unemployment Correlation Summary
| Measurement | Canadian | Bermudan |
| Minimum | 1.3% | 1.1% |
| Maximum | 25.9% | 10.9% |
| Range | 24.6% | 9.8% |
| Mean | 8.1% | 5.7% |
| Median | 7.0% | 5.6% |
| Interquartile 25% (IQ1) | 5.2% | 4.9% |
| Interquartile 75% (IQ3) | 8.8% | 6.6% |
| Interquartile Range (IQR) | 3.6% | 1.7% |
| Standard Deviation (Sample) | 5.1% | 2.1% |
| Standard Deviation (Population) | 5.1% | 2.1% |
Similar Demographics by Male Unemployment
Demographics Similar to Canadians by Male Unemployment
In terms of male unemployment, the demographic groups most similar to Canadians are Slavic (5.1%, a difference of 0.050%), Immigrants from Serbia (5.1%, a difference of 0.050%), Italian (5.1%, a difference of 0.080%), Immigrants from Turkey (5.1%, a difference of 0.10%), and Asian (5.1%, a difference of 0.10%).
| Demographics | Rating | Rank | Male Unemployment |
| Immigrants | Romania | 95.4 /100 | #87 | Exceptional 5.1% |
| Immigrants | Sri Lanka | 94.9 /100 | #88 | Exceptional 5.1% |
| Immigrants | Australia | 94.7 /100 | #89 | Exceptional 5.1% |
| Okinawans | 94.7 /100 | #90 | Exceptional 5.1% |
| Immigrants | Turkey | 94.4 /100 | #91 | Exceptional 5.1% |
| Slavs | 94.2 /100 | #92 | Exceptional 5.1% |
| Immigrants | Serbia | 94.2 /100 | #93 | Exceptional 5.1% |
| Canadians | 94.1 /100 | #94 | Exceptional 5.1% |
| Italians | 93.8 /100 | #95 | Exceptional 5.1% |
| Asians | 93.7 /100 | #96 | Exceptional 5.1% |
| Immigrants | Spain | 93.4 /100 | #97 | Exceptional 5.1% |
| Immigrants | Kuwait | 93.3 /100 | #98 | Exceptional 5.1% |
| Uruguayans | 93.0 /100 | #99 | Exceptional 5.1% |
| Russians | 92.9 /100 | #100 | Exceptional 5.1% |
| German Russians | 92.7 /100 | #101 | Exceptional 5.1% |
Demographics Similar to Bermudans by Male Unemployment
In terms of male unemployment, the demographic groups most similar to Bermudans are Nigerian (5.9%, a difference of 0.21%), Immigrants from Nigeria (6.0%, a difference of 0.27%), Bahamian (5.9%, a difference of 0.33%), Subsaharan African (6.0%, a difference of 0.40%), and French American Indian (5.9%, a difference of 0.47%).
| Demographics | Rating | Rank | Male Unemployment |
| Liberians | 0.1 /100 | #261 | Tragic 5.8% |
| Immigrants | Portugal | 0.1 /100 | #262 | Tragic 5.9% |
| Immigrants | Latin America | 0.1 /100 | #263 | Tragic 5.9% |
| Immigrants | Mexico | 0.0 /100 | #264 | Tragic 5.9% |
| French American Indians | 0.0 /100 | #265 | Tragic 5.9% |
| Bahamians | 0.0 /100 | #266 | Tragic 5.9% |
| Nigerians | 0.0 /100 | #267 | Tragic 5.9% |
| Bermudans | 0.0 /100 | #268 | Tragic 5.9% |
| Immigrants | Nigeria | 0.0 /100 | #269 | Tragic 6.0% |
| Sub-Saharan Africans | 0.0 /100 | #270 | Tragic 6.0% |
| Blackfeet | 0.0 /100 | #271 | Tragic 6.0% |
| Immigrants | Uzbekistan | 0.0 /100 | #272 | Tragic 6.0% |
| Armenians | 0.0 /100 | #273 | Tragic 6.0% |
| Immigrants | Sierra Leone | 0.0 /100 | #274 | Tragic 6.0% |
| Menominee | 0.0 /100 | #275 | Tragic 6.0% |