Jordanian vs Dutch West Indian Male Unemployment
COMPARE
Jordanian
Dutch West Indian
Male Unemployment
Male Unemployment Comparison
Jordanians
Dutch West Indians
5.0%
MALE UNEMPLOYMENT
98.8/ 100
METRIC RATING
53rd/ 347
METRIC RANK
5.8%
MALE UNEMPLOYMENT
0.1/ 100
METRIC RATING
258th/ 347
METRIC RANK
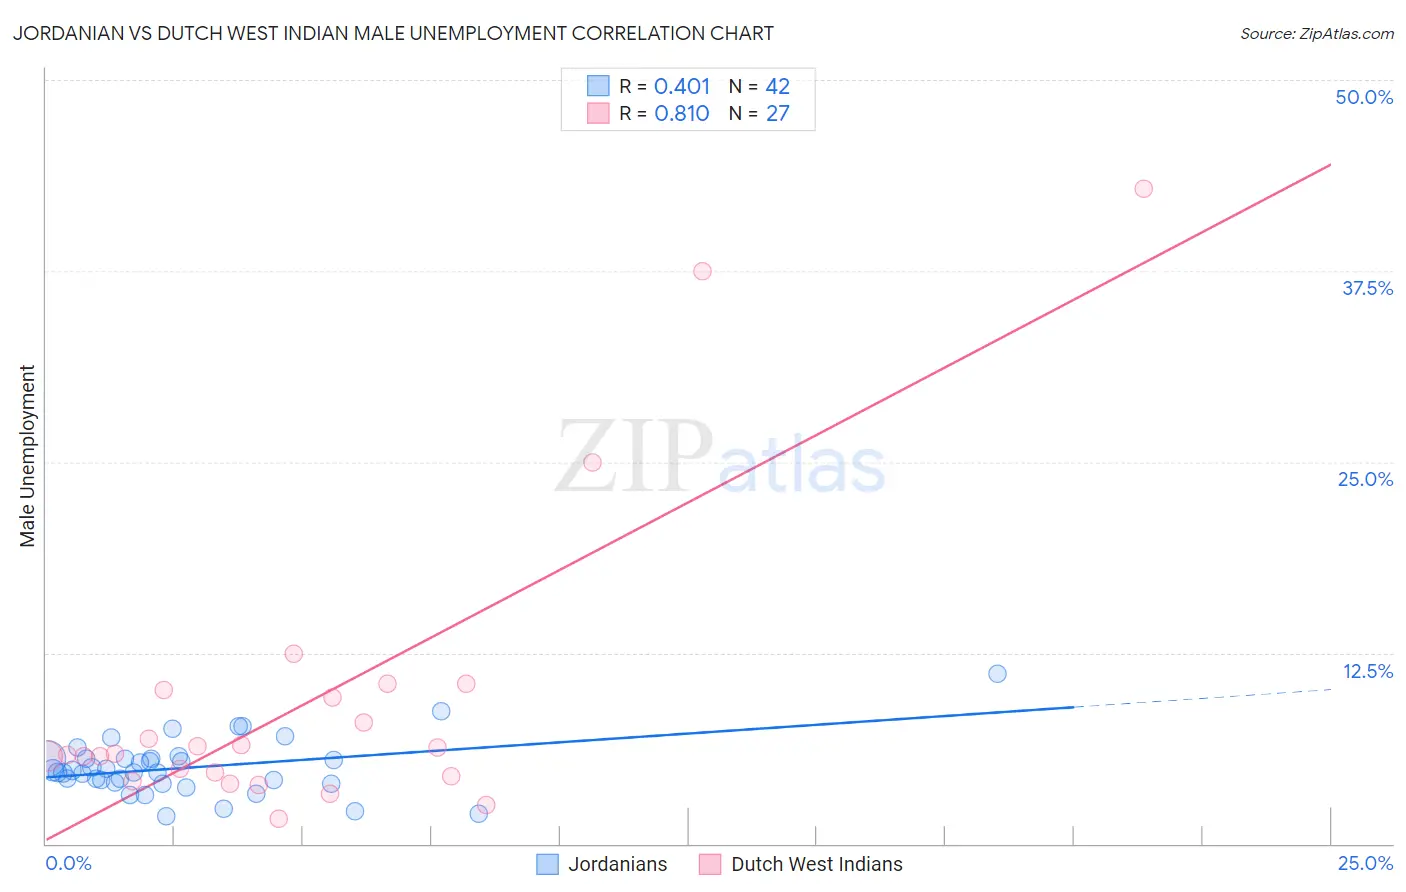
Jordanian vs Dutch West Indian Male Unemployment Correlation Chart
The statistical analysis conducted on geographies consisting of 166,295,233 people shows a moderate positive correlation between the proportion of Jordanians and unemployment rate among males in the United States with a correlation coefficient (R) of 0.401 and weighted average of 5.0%. Similarly, the statistical analysis conducted on geographies consisting of 85,545,191 people shows a very strong positive correlation between the proportion of Dutch West Indians and unemployment rate among males in the United States with a correlation coefficient (R) of 0.810 and weighted average of 5.8%, a difference of 17.3%.
Male Unemployment Correlation Summary
| Measurement | Jordanian | Dutch West Indian |
| Minimum | 1.8% | 1.6% |
| Maximum | 11.1% | 42.9% |
| Range | 9.3% | 41.3% |
| Mean | 5.0% | 9.4% |
| Median | 4.7% | 5.9% |
| Interquartile 25% (IQ1) | 4.0% | 4.4% |
| Interquartile 75% (IQ3) | 5.5% | 10.1% |
| Interquartile Range (IQR) | 1.6% | 5.7% |
| Standard Deviation (Sample) | 1.8% | 9.9% |
| Standard Deviation (Population) | 1.8% | 9.8% |
Similar Demographics by Male Unemployment
Demographics Similar to Jordanians by Male Unemployment
In terms of male unemployment, the demographic groups most similar to Jordanians are Irish (5.0%, a difference of 0.060%), Slovene (5.0%, a difference of 0.080%), Yugoslavian (5.0%, a difference of 0.10%), Croatian (4.9%, a difference of 0.11%), and Czechoslovakian (5.0%, a difference of 0.11%).
| Demographics | Rating | Rank | Male Unemployment |
| Bhutanese | 98.9 /100 | #46 | Exceptional 4.9% |
| Austrians | 98.9 /100 | #47 | Exceptional 4.9% |
| Immigrants | Scotland | 98.9 /100 | #48 | Exceptional 4.9% |
| Poles | 98.9 /100 | #49 | Exceptional 4.9% |
| Croatians | 98.9 /100 | #50 | Exceptional 4.9% |
| Slovenes | 98.8 /100 | #51 | Exceptional 5.0% |
| Irish | 98.8 /100 | #52 | Exceptional 5.0% |
| Jordanians | 98.8 /100 | #53 | Exceptional 5.0% |
| Yugoslavians | 98.7 /100 | #54 | Exceptional 5.0% |
| Czechoslovakians | 98.7 /100 | #55 | Exceptional 5.0% |
| Immigrants | Bulgaria | 98.7 /100 | #56 | Exceptional 5.0% |
| Turks | 98.5 /100 | #57 | Exceptional 5.0% |
| Lithuanians | 98.5 /100 | #58 | Exceptional 5.0% |
| Immigrants | Netherlands | 98.3 /100 | #59 | Exceptional 5.0% |
| Immigrants | Argentina | 98.1 /100 | #60 | Exceptional 5.0% |
Demographics Similar to Dutch West Indians by Male Unemployment
In terms of male unemployment, the demographic groups most similar to Dutch West Indians are Hispanic or Latino (5.8%, a difference of 0.14%), Cajun (5.8%, a difference of 0.15%), Immigrants from Central America (5.8%, a difference of 0.21%), Comanche (5.8%, a difference of 0.30%), and Kiowa (5.8%, a difference of 0.38%).
| Demographics | Rating | Rank | Male Unemployment |
| Spanish Americans | 0.3 /100 | #251 | Tragic 5.7% |
| Mexicans | 0.2 /100 | #252 | Tragic 5.8% |
| Mexican American Indians | 0.2 /100 | #253 | Tragic 5.8% |
| Japanese | 0.2 /100 | #254 | Tragic 5.8% |
| Kiowa | 0.2 /100 | #255 | Tragic 5.8% |
| Comanche | 0.2 /100 | #256 | Tragic 5.8% |
| Hispanics or Latinos | 0.1 /100 | #257 | Tragic 5.8% |
| Dutch West Indians | 0.1 /100 | #258 | Tragic 5.8% |
| Cajuns | 0.1 /100 | #259 | Tragic 5.8% |
| Immigrants | Central America | 0.1 /100 | #260 | Tragic 5.8% |
| Liberians | 0.1 /100 | #261 | Tragic 5.8% |
| Immigrants | Portugal | 0.1 /100 | #262 | Tragic 5.9% |
| Immigrants | Latin America | 0.1 /100 | #263 | Tragic 5.9% |
| Immigrants | Mexico | 0.0 /100 | #264 | Tragic 5.9% |
| French American Indians | 0.0 /100 | #265 | Tragic 5.9% |