Black/African American vs Immigrants from Burma/Myanmar Unemployment Among Ages 30 to 34 years
COMPARE
Black/African American
Immigrants from Burma/Myanmar
Unemployment Among Ages 30 to 34 years
Unemployment Among Ages 30 to 34 years Comparison
Blacks/African Americans
Immigrants from Burma/Myanmar
7.2%
UNEMPLOYMENT AMONG AGES 30 TO 34 YEARS
0.0/ 100
METRIC RATING
318th/ 347
METRIC RANK
5.1%
UNEMPLOYMENT AMONG AGES 30 TO 34 YEARS
98.1/ 100
METRIC RATING
52nd/ 347
METRIC RANK
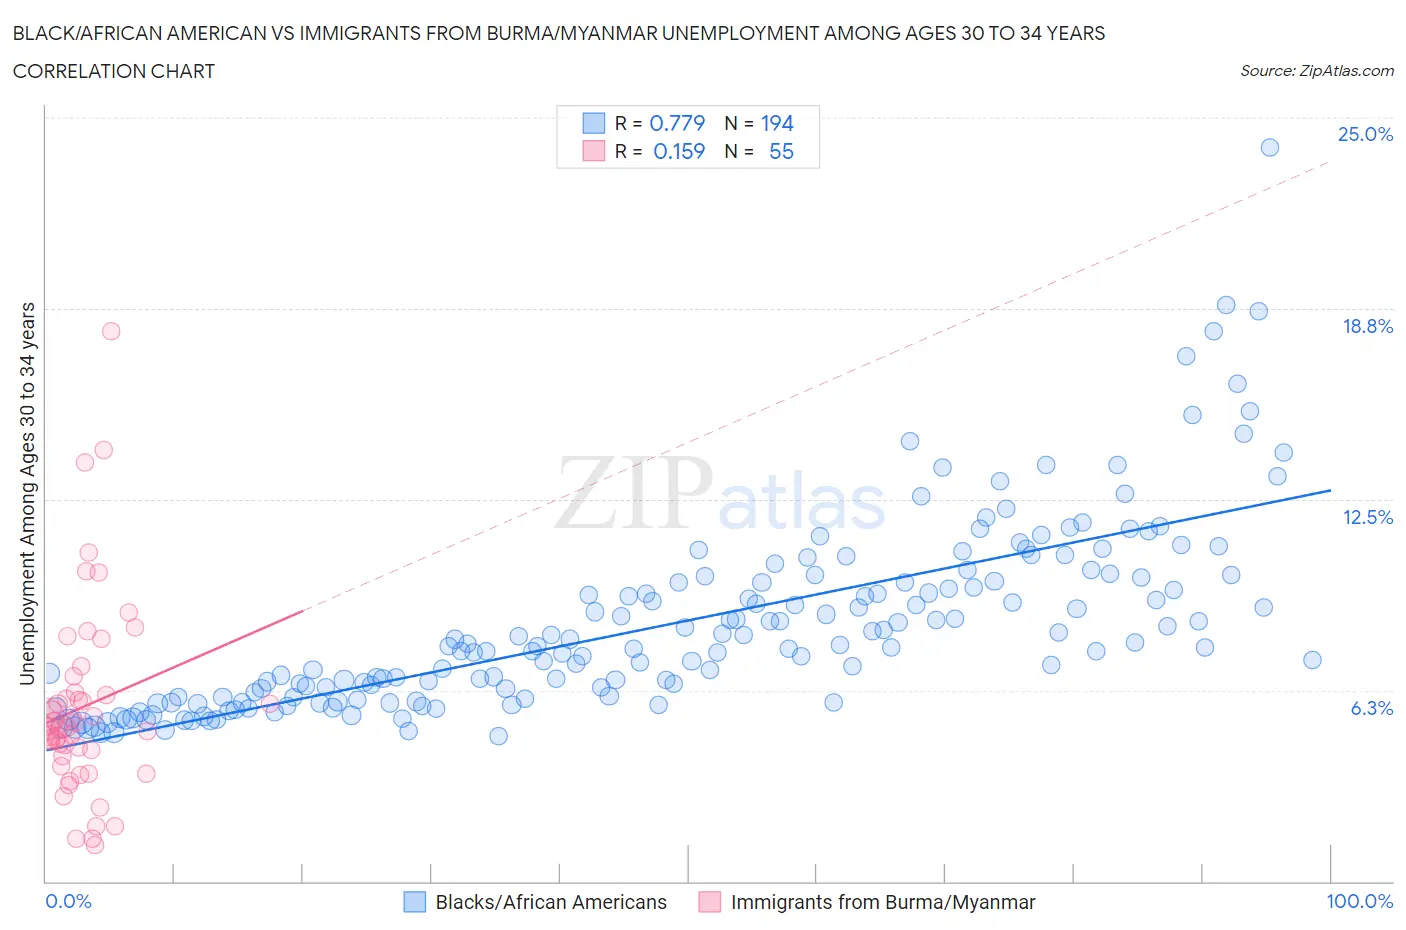
Black/African American vs Immigrants from Burma/Myanmar Unemployment Among Ages 30 to 34 years Correlation Chart
The statistical analysis conducted on geographies consisting of 499,385,483 people shows a strong positive correlation between the proportion of Blacks/African Americans and unemployment rate among population between the ages 30 and 34 in the United States with a correlation coefficient (R) of 0.779 and weighted average of 7.2%. Similarly, the statistical analysis conducted on geographies consisting of 168,858,886 people shows a poor positive correlation between the proportion of Immigrants from Burma/Myanmar and unemployment rate among population between the ages 30 and 34 in the United States with a correlation coefficient (R) of 0.159 and weighted average of 5.1%, a difference of 41.2%.
Unemployment Among Ages 30 to 34 years Correlation Summary
| Measurement | Black/African American | Immigrants from Burma/Myanmar |
| Minimum | 4.7% | 1.2% |
| Maximum | 24.0% | 18.0% |
| Range | 19.3% | 16.8% |
| Mean | 8.4% | 5.7% |
| Median | 7.7% | 5.0% |
| Interquartile 25% (IQ1) | 6.0% | 4.1% |
| Interquartile 75% (IQ3) | 9.8% | 6.2% |
| Interquartile Range (IQR) | 3.8% | 2.1% |
| Standard Deviation (Sample) | 3.1% | 3.2% |
| Standard Deviation (Population) | 3.1% | 3.1% |
Similar Demographics by Unemployment Among Ages 30 to 34 years
Demographics Similar to Blacks/African Americans by Unemployment Among Ages 30 to 34 years
In terms of unemployment among ages 30 to 34 years, the demographic groups most similar to Blacks/African Americans are Guyanese (7.2%, a difference of 0.060%), Cape Verdean (7.2%, a difference of 0.090%), Immigrants from Cabo Verde (7.2%, a difference of 0.10%), Houma (7.2%, a difference of 0.37%), and Immigrants from Guyana (7.2%, a difference of 0.38%).
| Demographics | Rating | Rank | Unemployment Among Ages 30 to 34 years |
| Alaskan Athabascans | 0.0 /100 | #311 | Tragic 7.0% |
| British West Indians | 0.0 /100 | #312 | Tragic 7.0% |
| Ute | 0.0 /100 | #313 | Tragic 7.0% |
| Lumbee | 0.0 /100 | #314 | Tragic 7.1% |
| Aleuts | 0.0 /100 | #315 | Tragic 7.1% |
| Houma | 0.0 /100 | #316 | Tragic 7.2% |
| Immigrants | Cabo Verde | 0.0 /100 | #317 | Tragic 7.2% |
| Blacks/African Americans | 0.0 /100 | #318 | Tragic 7.2% |
| Guyanese | 0.0 /100 | #319 | Tragic 7.2% |
| Cape Verdeans | 0.0 /100 | #320 | Tragic 7.2% |
| Immigrants | Guyana | 0.0 /100 | #321 | Tragic 7.2% |
| Marshallese | 0.0 /100 | #322 | Tragic 7.2% |
| Immigrants | Yemen | 0.0 /100 | #323 | Tragic 7.3% |
| Immigrants | Dominica | 0.0 /100 | #324 | Tragic 7.3% |
| Apache | 0.0 /100 | #325 | Tragic 7.3% |
Demographics Similar to Immigrants from Burma/Myanmar by Unemployment Among Ages 30 to 34 years
In terms of unemployment among ages 30 to 34 years, the demographic groups most similar to Immigrants from Burma/Myanmar are Turkish (5.1%, a difference of 0.040%), Cuban (5.1%, a difference of 0.050%), Puget Sound Salish (5.1%, a difference of 0.070%), Immigrants from Malaysia (5.1%, a difference of 0.14%), and Immigrants from Morocco (5.1%, a difference of 0.23%).
| Demographics | Rating | Rank | Unemployment Among Ages 30 to 34 years |
| Yugoslavians | 98.6 /100 | #45 | Exceptional 5.1% |
| Immigrants | Congo | 98.4 /100 | #46 | Exceptional 5.1% |
| Cypriots | 98.4 /100 | #47 | Exceptional 5.1% |
| Assyrians/Chaldeans/Syriacs | 98.4 /100 | #48 | Exceptional 5.1% |
| Immigrants | Malaysia | 98.3 /100 | #49 | Exceptional 5.1% |
| Puget Sound Salish | 98.2 /100 | #50 | Exceptional 5.1% |
| Turks | 98.2 /100 | #51 | Exceptional 5.1% |
| Immigrants | Burma/Myanmar | 98.1 /100 | #52 | Exceptional 5.1% |
| Cubans | 98.1 /100 | #53 | Exceptional 5.1% |
| Immigrants | Morocco | 97.9 /100 | #54 | Exceptional 5.1% |
| Chinese | 97.7 /100 | #55 | Exceptional 5.1% |
| Immigrants | Serbia | 97.4 /100 | #56 | Exceptional 5.1% |
| Immigrants | China | 97.2 /100 | #57 | Exceptional 5.1% |
| Asians | 97.2 /100 | #58 | Exceptional 5.1% |
| Swedes | 97.1 /100 | #59 | Exceptional 5.1% |