Argentinean vs Immigrants from Middle Africa Female Unemployment
COMPARE
Argentinean
Immigrants from Middle Africa
Female Unemployment
Female Unemployment Comparison
Argentineans
Immigrants from Middle Africa
5.2%
FEMALE UNEMPLOYMENT
79.2/ 100
METRIC RATING
147th/ 347
METRIC RANK
5.4%
FEMALE UNEMPLOYMENT
20.8/ 100
METRIC RATING
201st/ 347
METRIC RANK
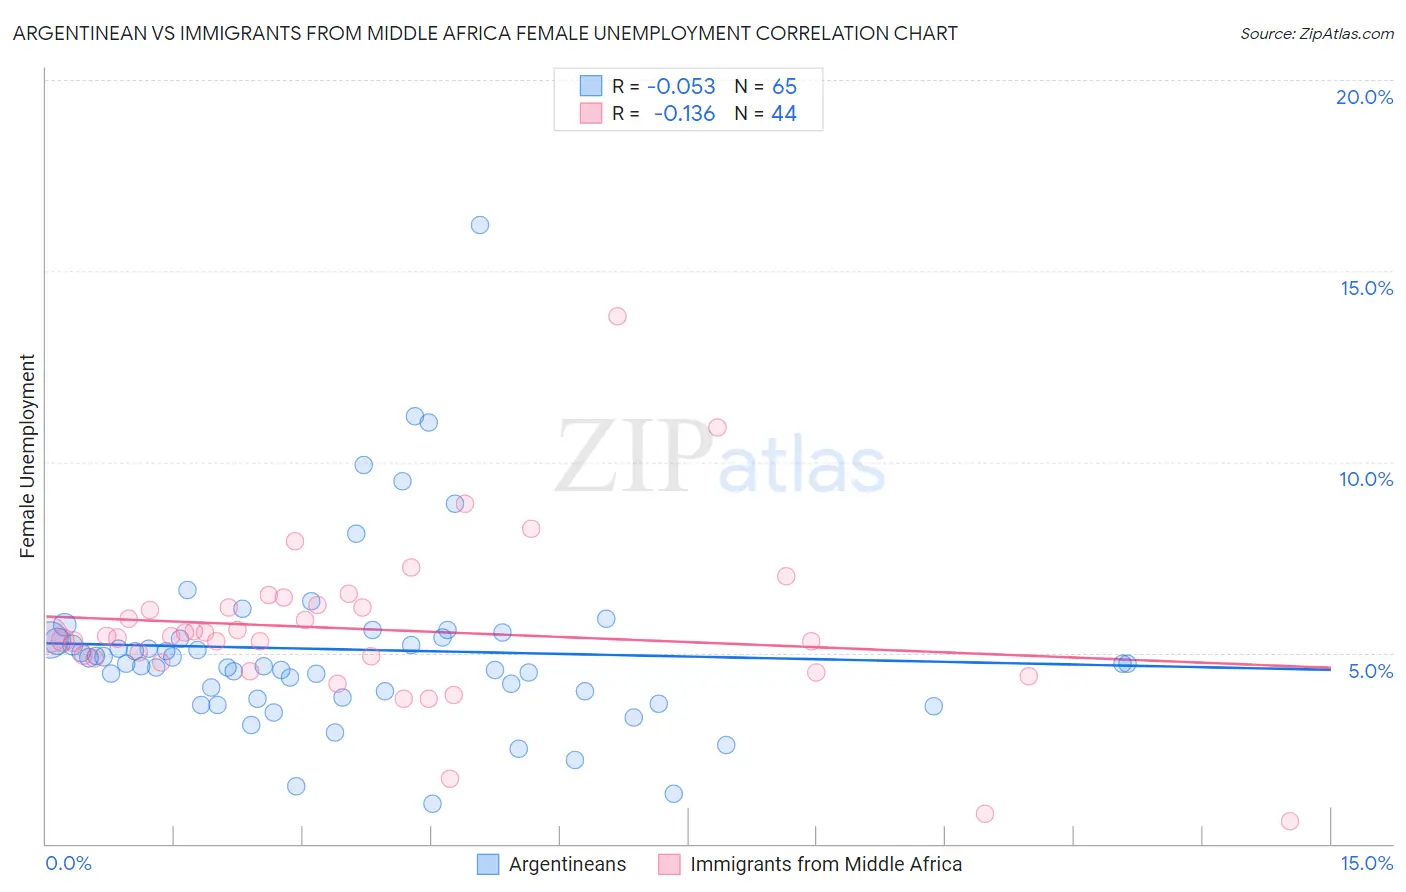
Argentinean vs Immigrants from Middle Africa Female Unemployment Correlation Chart
The statistical analysis conducted on geographies consisting of 296,580,968 people shows a slight negative correlation between the proportion of Argentineans and unemploymnet rate among females in the United States with a correlation coefficient (R) of -0.053 and weighted average of 5.2%. Similarly, the statistical analysis conducted on geographies consisting of 202,480,571 people shows a poor negative correlation between the proportion of Immigrants from Middle Africa and unemploymnet rate among females in the United States with a correlation coefficient (R) of -0.136 and weighted average of 5.4%, a difference of 4.1%.
Female Unemployment Correlation Summary
| Measurement | Argentinean | Immigrants from Middle Africa |
| Minimum | 1.0% | 0.60% |
| Maximum | 16.2% | 13.8% |
| Range | 15.2% | 13.2% |
| Mean | 5.1% | 5.6% |
| Median | 4.7% | 5.4% |
| Interquartile 25% (IQ1) | 3.9% | 4.8% |
| Interquartile 75% (IQ3) | 5.4% | 6.2% |
| Interquartile Range (IQR) | 1.5% | 1.4% |
| Standard Deviation (Sample) | 2.4% | 2.2% |
| Standard Deviation (Population) | 2.4% | 2.2% |
Similar Demographics by Female Unemployment
Demographics Similar to Argentineans by Female Unemployment
In terms of female unemployment, the demographic groups most similar to Argentineans are Immigrants from Norway (5.2%, a difference of 0.020%), Immigrants from Oceania (5.2%, a difference of 0.030%), Immigrants from Argentina (5.2%, a difference of 0.050%), Asian (5.2%, a difference of 0.080%), and Egyptian (5.2%, a difference of 0.080%).
| Demographics | Rating | Rank | Female Unemployment |
| Immigrants | France | 82.7 /100 | #140 | Excellent 5.1% |
| Immigrants | Eastern Europe | 81.5 /100 | #141 | Excellent 5.1% |
| Palestinians | 80.8 /100 | #142 | Excellent 5.1% |
| Immigrants | Kazakhstan | 80.7 /100 | #143 | Excellent 5.1% |
| Immigrants | Jordan | 80.4 /100 | #144 | Excellent 5.1% |
| Immigrants | Oceania | 79.5 /100 | #145 | Good 5.2% |
| Immigrants | Norway | 79.4 /100 | #146 | Good 5.2% |
| Argentineans | 79.2 /100 | #147 | Good 5.2% |
| Immigrants | Argentina | 78.7 /100 | #148 | Good 5.2% |
| Asians | 78.3 /100 | #149 | Good 5.2% |
| Egyptians | 78.3 /100 | #150 | Good 5.2% |
| Immigrants | China | 75.9 /100 | #151 | Good 5.2% |
| Immigrants | Italy | 75.0 /100 | #152 | Good 5.2% |
| Immigrants | Greece | 74.9 /100 | #153 | Good 5.2% |
| South Africans | 70.8 /100 | #154 | Good 5.2% |
Demographics Similar to Immigrants from Middle Africa by Female Unemployment
In terms of female unemployment, the demographic groups most similar to Immigrants from Middle Africa are Iroquois (5.4%, a difference of 0.0%), Immigrants from South Eastern Asia (5.4%, a difference of 0.040%), Soviet Union (5.4%, a difference of 0.080%), Immigrants from Israel (5.4%, a difference of 0.10%), and Hawaiian (5.4%, a difference of 0.12%).
| Demographics | Rating | Rank | Female Unemployment |
| Colombians | 27.0 /100 | #194 | Fair 5.3% |
| Immigrants | Colombia | 26.2 /100 | #195 | Fair 5.3% |
| Spaniards | 25.2 /100 | #196 | Fair 5.3% |
| Alsatians | 23.9 /100 | #197 | Fair 5.3% |
| Tsimshian | 23.1 /100 | #198 | Fair 5.4% |
| Hawaiians | 22.2 /100 | #199 | Fair 5.4% |
| Soviet Union | 21.7 /100 | #200 | Fair 5.4% |
| Immigrants | Middle Africa | 20.8 /100 | #201 | Fair 5.4% |
| Iroquois | 20.8 /100 | #202 | Fair 5.4% |
| Immigrants | South Eastern Asia | 20.3 /100 | #203 | Fair 5.4% |
| Immigrants | Israel | 19.7 /100 | #204 | Poor 5.4% |
| Immigrants | Afghanistan | 18.9 /100 | #205 | Poor 5.4% |
| Immigrants | Brazil | 18.8 /100 | #206 | Poor 5.4% |
| Creek | 15.4 /100 | #207 | Poor 5.4% |
| Immigrants | Costa Rica | 13.7 /100 | #208 | Poor 5.4% |