Argentinean vs Immigrants from Cuba Female Unemployment
COMPARE
Argentinean
Immigrants from Cuba
Female Unemployment
Female Unemployment Comparison
Argentineans
Immigrants from Cuba
5.2%
FEMALE UNEMPLOYMENT
79.2/ 100
METRIC RATING
147th/ 347
METRIC RANK
4.9%
FEMALE UNEMPLOYMENT
99.1/ 100
METRIC RATING
50th/ 347
METRIC RANK
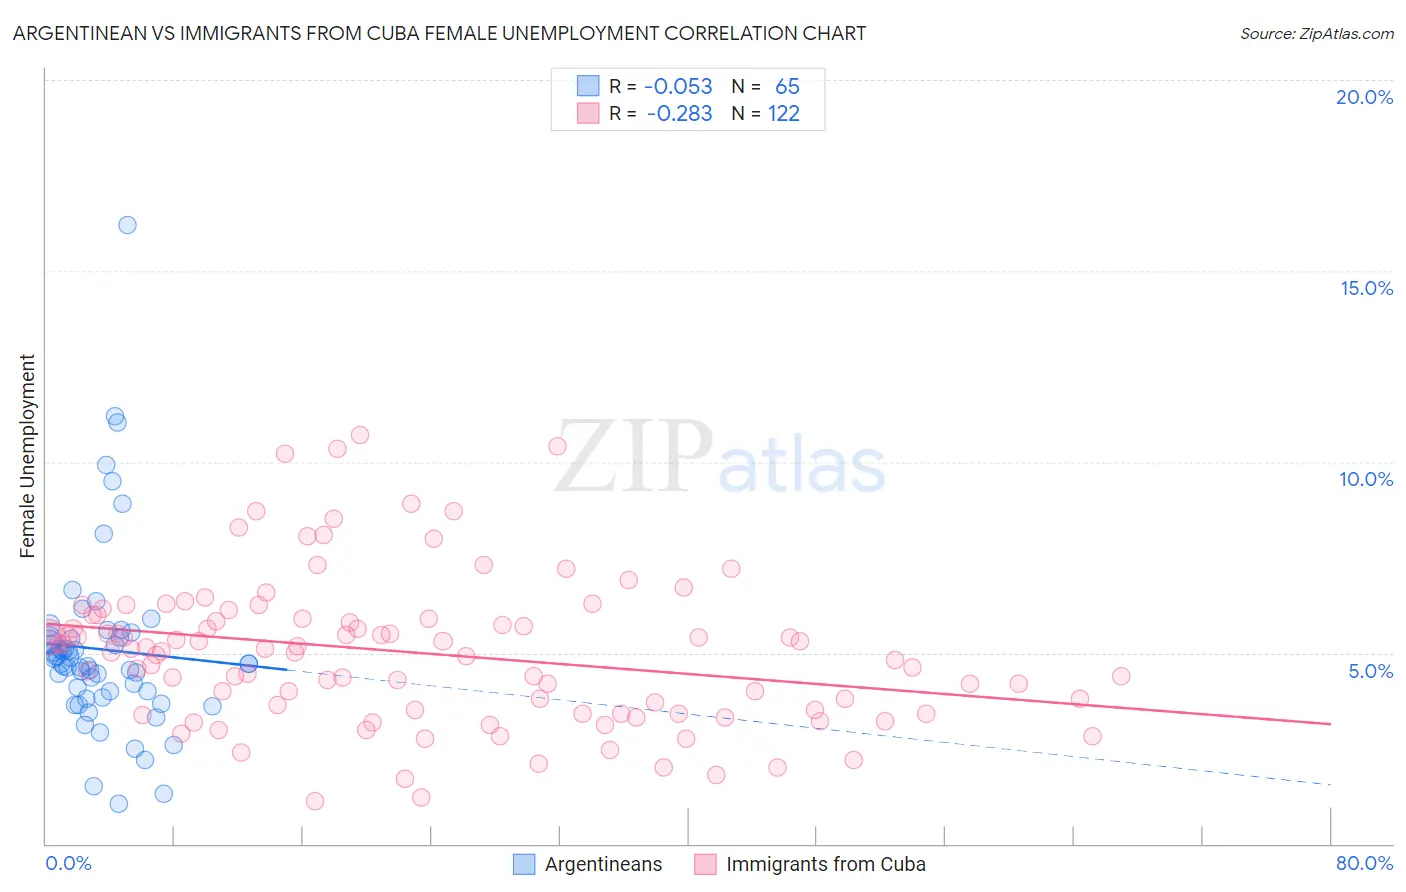
Argentinean vs Immigrants from Cuba Female Unemployment Correlation Chart
The statistical analysis conducted on geographies consisting of 296,580,968 people shows a slight negative correlation between the proportion of Argentineans and unemploymnet rate among females in the United States with a correlation coefficient (R) of -0.053 and weighted average of 5.2%. Similarly, the statistical analysis conducted on geographies consisting of 325,054,081 people shows a weak negative correlation between the proportion of Immigrants from Cuba and unemploymnet rate among females in the United States with a correlation coefficient (R) of -0.283 and weighted average of 4.9%, a difference of 5.4%.
Female Unemployment Correlation Summary
| Measurement | Argentinean | Immigrants from Cuba |
| Minimum | 1.0% | 1.1% |
| Maximum | 16.2% | 10.7% |
| Range | 15.2% | 9.6% |
| Mean | 5.1% | 5.0% |
| Median | 4.7% | 5.1% |
| Interquartile 25% (IQ1) | 3.9% | 3.5% |
| Interquartile 75% (IQ3) | 5.4% | 5.9% |
| Interquartile Range (IQR) | 1.5% | 2.4% |
| Standard Deviation (Sample) | 2.4% | 1.9% |
| Standard Deviation (Population) | 2.4% | 1.9% |
Similar Demographics by Female Unemployment
Demographics Similar to Argentineans by Female Unemployment
In terms of female unemployment, the demographic groups most similar to Argentineans are Immigrants from Norway (5.2%, a difference of 0.020%), Immigrants from Oceania (5.2%, a difference of 0.030%), Immigrants from Argentina (5.2%, a difference of 0.050%), Asian (5.2%, a difference of 0.080%), and Egyptian (5.2%, a difference of 0.080%).
| Demographics | Rating | Rank | Female Unemployment |
| Immigrants | France | 82.7 /100 | #140 | Excellent 5.1% |
| Immigrants | Eastern Europe | 81.5 /100 | #141 | Excellent 5.1% |
| Palestinians | 80.8 /100 | #142 | Excellent 5.1% |
| Immigrants | Kazakhstan | 80.7 /100 | #143 | Excellent 5.1% |
| Immigrants | Jordan | 80.4 /100 | #144 | Excellent 5.1% |
| Immigrants | Oceania | 79.5 /100 | #145 | Good 5.2% |
| Immigrants | Norway | 79.4 /100 | #146 | Good 5.2% |
| Argentineans | 79.2 /100 | #147 | Good 5.2% |
| Immigrants | Argentina | 78.7 /100 | #148 | Good 5.2% |
| Asians | 78.3 /100 | #149 | Good 5.2% |
| Egyptians | 78.3 /100 | #150 | Good 5.2% |
| Immigrants | China | 75.9 /100 | #151 | Good 5.2% |
| Immigrants | Italy | 75.0 /100 | #152 | Good 5.2% |
| Immigrants | Greece | 74.9 /100 | #153 | Good 5.2% |
| South Africans | 70.8 /100 | #154 | Good 5.2% |
Demographics Similar to Immigrants from Cuba by Female Unemployment
In terms of female unemployment, the demographic groups most similar to Immigrants from Cuba are Cambodian (4.9%, a difference of 0.020%), Slavic (4.9%, a difference of 0.040%), White/Caucasian (4.9%, a difference of 0.070%), Immigrants from Zimbabwe (4.9%, a difference of 0.13%), and Immigrants from Moldova (4.9%, a difference of 0.14%).
| Demographics | Rating | Rank | Female Unemployment |
| Eastern Europeans | 99.4 /100 | #43 | Exceptional 4.9% |
| Greeks | 99.4 /100 | #44 | Exceptional 4.9% |
| Austrians | 99.3 /100 | #45 | Exceptional 4.9% |
| Immigrants | Bulgaria | 99.3 /100 | #46 | Exceptional 4.9% |
| Okinawans | 99.3 /100 | #47 | Exceptional 4.9% |
| Thais | 99.2 /100 | #48 | Exceptional 4.9% |
| Australians | 99.2 /100 | #49 | Exceptional 4.9% |
| Immigrants | Cuba | 99.1 /100 | #50 | Exceptional 4.9% |
| Cambodians | 99.1 /100 | #51 | Exceptional 4.9% |
| Slavs | 99.1 /100 | #52 | Exceptional 4.9% |
| Whites/Caucasians | 99.0 /100 | #53 | Exceptional 4.9% |
| Immigrants | Zimbabwe | 99.0 /100 | #54 | Exceptional 4.9% |
| Immigrants | Moldova | 99.0 /100 | #55 | Exceptional 4.9% |
| Serbians | 99.0 /100 | #56 | Exceptional 4.9% |
| Icelanders | 98.8 /100 | #57 | Exceptional 4.9% |