Argentinean vs Immigrants from India Female Unemployment
COMPARE
Argentinean
Immigrants from India
Female Unemployment
Female Unemployment Comparison
Argentineans
Immigrants from India
5.2%
FEMALE UNEMPLOYMENT
79.2/ 100
METRIC RATING
147th/ 347
METRIC RANK
4.7%
FEMALE UNEMPLOYMENT
99.9/ 100
METRIC RATING
25th/ 347
METRIC RANK
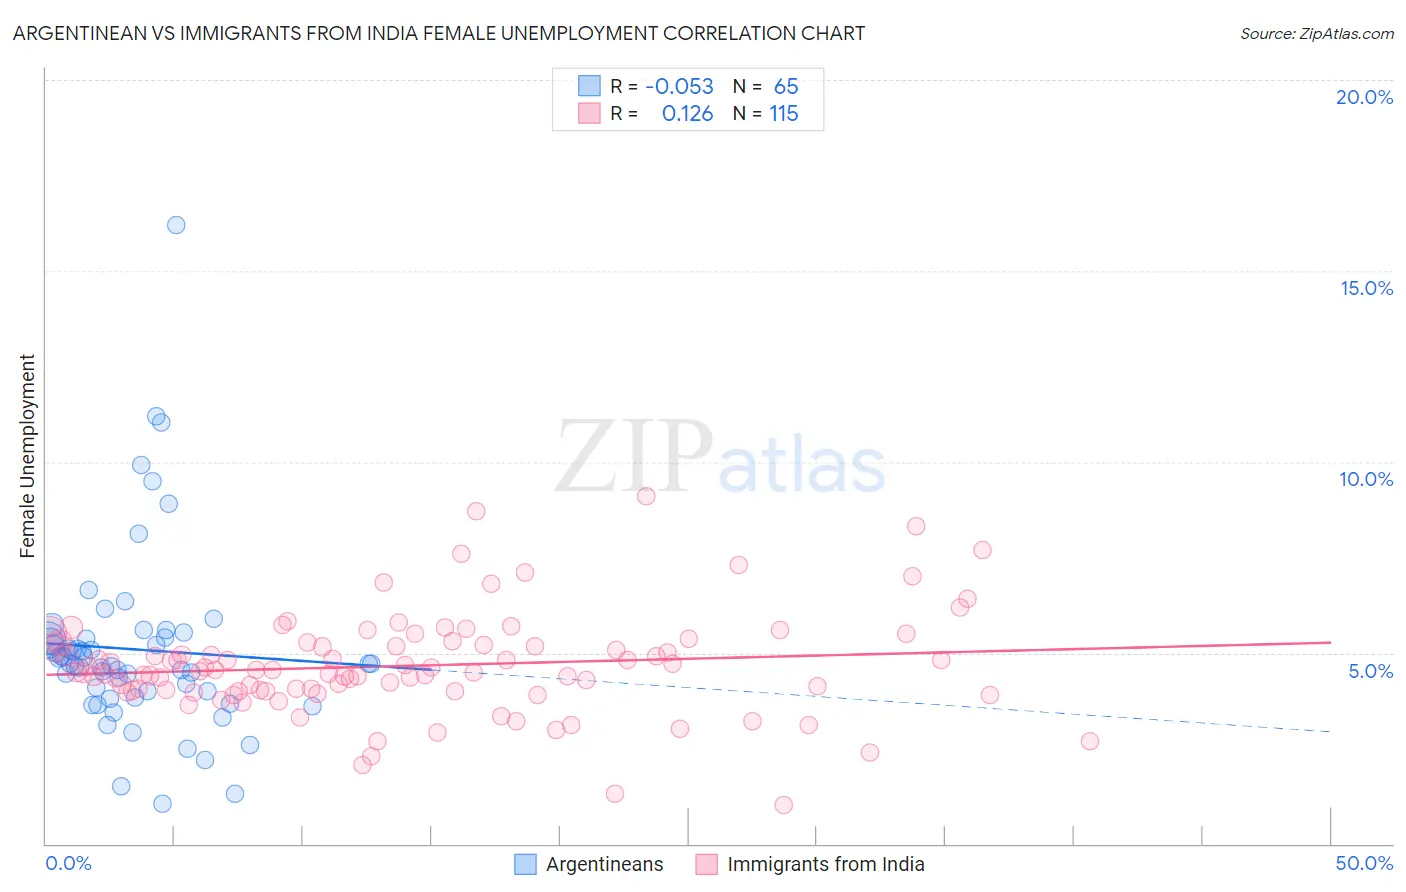
Argentinean vs Immigrants from India Female Unemployment Correlation Chart
The statistical analysis conducted on geographies consisting of 296,580,968 people shows a slight negative correlation between the proportion of Argentineans and unemploymnet rate among females in the United States with a correlation coefficient (R) of -0.053 and weighted average of 5.2%. Similarly, the statistical analysis conducted on geographies consisting of 431,990,164 people shows a poor positive correlation between the proportion of Immigrants from India and unemploymnet rate among females in the United States with a correlation coefficient (R) of 0.126 and weighted average of 4.7%, a difference of 9.0%.
Female Unemployment Correlation Summary
| Measurement | Argentinean | Immigrants from India |
| Minimum | 1.0% | 1.0% |
| Maximum | 16.2% | 9.1% |
| Range | 15.2% | 8.1% |
| Mean | 5.1% | 4.7% |
| Median | 4.7% | 4.5% |
| Interquartile 25% (IQ1) | 3.9% | 4.0% |
| Interquartile 75% (IQ3) | 5.4% | 5.2% |
| Interquartile Range (IQR) | 1.5% | 1.2% |
| Standard Deviation (Sample) | 2.4% | 1.3% |
| Standard Deviation (Population) | 2.4% | 1.3% |
Similar Demographics by Female Unemployment
Demographics Similar to Argentineans by Female Unemployment
In terms of female unemployment, the demographic groups most similar to Argentineans are Immigrants from Norway (5.2%, a difference of 0.020%), Immigrants from Oceania (5.2%, a difference of 0.030%), Immigrants from Argentina (5.2%, a difference of 0.050%), Asian (5.2%, a difference of 0.080%), and Egyptian (5.2%, a difference of 0.080%).
| Demographics | Rating | Rank | Female Unemployment |
| Immigrants | France | 82.7 /100 | #140 | Excellent 5.1% |
| Immigrants | Eastern Europe | 81.5 /100 | #141 | Excellent 5.1% |
| Palestinians | 80.8 /100 | #142 | Excellent 5.1% |
| Immigrants | Kazakhstan | 80.7 /100 | #143 | Excellent 5.1% |
| Immigrants | Jordan | 80.4 /100 | #144 | Excellent 5.1% |
| Immigrants | Oceania | 79.5 /100 | #145 | Good 5.2% |
| Immigrants | Norway | 79.4 /100 | #146 | Good 5.2% |
| Argentineans | 79.2 /100 | #147 | Good 5.2% |
| Immigrants | Argentina | 78.7 /100 | #148 | Good 5.2% |
| Asians | 78.3 /100 | #149 | Good 5.2% |
| Egyptians | 78.3 /100 | #150 | Good 5.2% |
| Immigrants | China | 75.9 /100 | #151 | Good 5.2% |
| Immigrants | Italy | 75.0 /100 | #152 | Good 5.2% |
| Immigrants | Greece | 74.9 /100 | #153 | Good 5.2% |
| South Africans | 70.8 /100 | #154 | Good 5.2% |
Demographics Similar to Immigrants from India by Female Unemployment
In terms of female unemployment, the demographic groups most similar to Immigrants from India are Immigrants from Bosnia and Herzegovina (4.7%, a difference of 0.040%), Welsh (4.7%, a difference of 0.090%), British (4.7%, a difference of 0.20%), Irish (4.7%, a difference of 0.24%), and Cypriot (4.7%, a difference of 0.24%).
| Demographics | Rating | Rank | Female Unemployment |
| Latvians | 99.9 /100 | #18 | Exceptional 4.7% |
| Poles | 99.9 /100 | #19 | Exceptional 4.7% |
| Bulgarians | 99.9 /100 | #20 | Exceptional 4.7% |
| Fijians | 99.9 /100 | #21 | Exceptional 4.7% |
| Europeans | 99.9 /100 | #22 | Exceptional 4.7% |
| Scottish | 99.9 /100 | #23 | Exceptional 4.7% |
| Welsh | 99.9 /100 | #24 | Exceptional 4.7% |
| Immigrants | India | 99.9 /100 | #25 | Exceptional 4.7% |
| Immigrants | Bosnia and Herzegovina | 99.9 /100 | #26 | Exceptional 4.7% |
| British | 99.9 /100 | #27 | Exceptional 4.7% |
| Irish | 99.9 /100 | #28 | Exceptional 4.7% |
| Cypriots | 99.9 /100 | #29 | Exceptional 4.7% |
| Lithuanians | 99.8 /100 | #30 | Exceptional 4.7% |
| Sudanese | 99.8 /100 | #31 | Exceptional 4.8% |
| Slovaks | 99.8 /100 | #32 | Exceptional 4.8% |