Laotian vs Immigrants from Middle Africa Female Unemployment
COMPARE
Laotian
Immigrants from Middle Africa
Female Unemployment
Female Unemployment Comparison
Laotians
Immigrants from Middle Africa
5.3%
FEMALE UNEMPLOYMENT
45.1/ 100
METRIC RATING
179th/ 347
METRIC RANK
5.4%
FEMALE UNEMPLOYMENT
20.8/ 100
METRIC RATING
201st/ 347
METRIC RANK
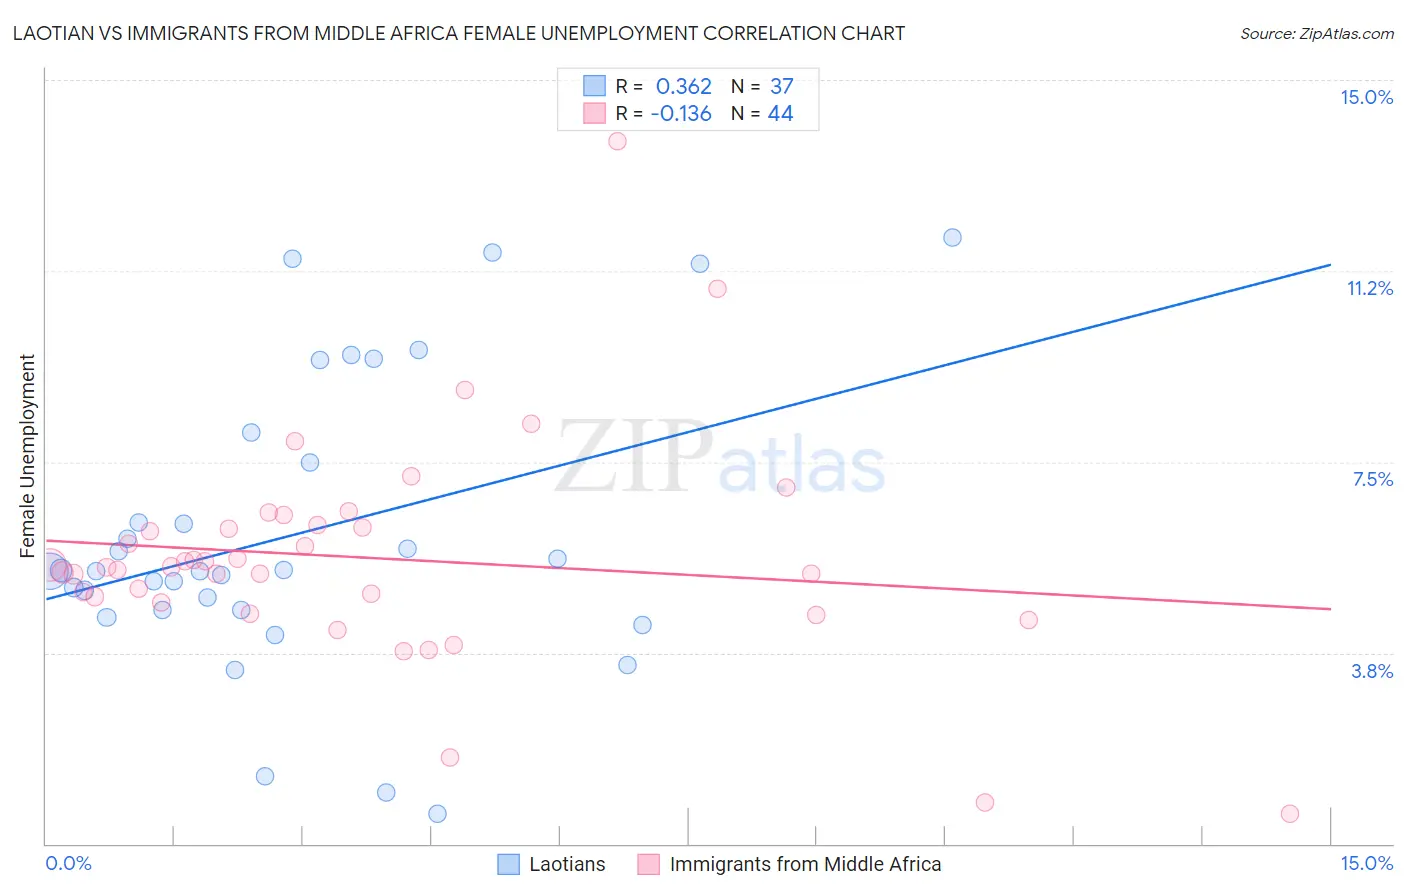
Laotian vs Immigrants from Middle Africa Female Unemployment Correlation Chart
The statistical analysis conducted on geographies consisting of 224,555,281 people shows a mild positive correlation between the proportion of Laotians and unemploymnet rate among females in the United States with a correlation coefficient (R) of 0.362 and weighted average of 5.3%. Similarly, the statistical analysis conducted on geographies consisting of 202,480,571 people shows a poor negative correlation between the proportion of Immigrants from Middle Africa and unemploymnet rate among females in the United States with a correlation coefficient (R) of -0.136 and weighted average of 5.4%, a difference of 1.7%.
Female Unemployment Correlation Summary
| Measurement | Laotian | Immigrants from Middle Africa |
| Minimum | 0.60% | 0.60% |
| Maximum | 11.9% | 13.8% |
| Range | 11.3% | 13.2% |
| Mean | 6.1% | 5.6% |
| Median | 5.4% | 5.4% |
| Interquartile 25% (IQ1) | 4.6% | 4.8% |
| Interquartile 75% (IQ3) | 7.8% | 6.2% |
| Interquartile Range (IQR) | 3.2% | 1.4% |
| Standard Deviation (Sample) | 2.9% | 2.2% |
| Standard Deviation (Population) | 2.8% | 2.2% |
Similar Demographics by Female Unemployment
Demographics Similar to Laotians by Female Unemployment
In terms of female unemployment, the demographic groups most similar to Laotians are Immigrants from Southern Europe (5.3%, a difference of 0.070%), Immigrants from Congo (5.3%, a difference of 0.12%), Immigrants from Vietnam (5.3%, a difference of 0.14%), Immigrants from Morocco (5.3%, a difference of 0.14%), and Taiwanese (5.3%, a difference of 0.14%).
| Demographics | Rating | Rank | Female Unemployment |
| Immigrants | Uganda | 50.7 /100 | #172 | Average 5.3% |
| Iranians | 50.4 /100 | #173 | Average 5.3% |
| Immigrants | Poland | 50.0 /100 | #174 | Average 5.3% |
| Immigrants | Laos | 47.5 /100 | #175 | Average 5.3% |
| Immigrants | Vietnam | 47.5 /100 | #176 | Average 5.3% |
| Immigrants | Morocco | 47.4 /100 | #177 | Average 5.3% |
| Immigrants | Southern Europe | 46.2 /100 | #178 | Average 5.3% |
| Laotians | 45.1 /100 | #179 | Average 5.3% |
| Immigrants | Congo | 43.1 /100 | #180 | Average 5.3% |
| Taiwanese | 42.7 /100 | #181 | Average 5.3% |
| Immigrants | Nonimmigrants | 42.6 /100 | #182 | Average 5.3% |
| Immigrants | Indonesia | 40.7 /100 | #183 | Average 5.3% |
| Immigrants | Ukraine | 40.1 /100 | #184 | Average 5.3% |
| Malaysians | 40.1 /100 | #185 | Average 5.3% |
| Immigrants | Belarus | 39.4 /100 | #186 | Fair 5.3% |
Demographics Similar to Immigrants from Middle Africa by Female Unemployment
In terms of female unemployment, the demographic groups most similar to Immigrants from Middle Africa are Iroquois (5.4%, a difference of 0.0%), Immigrants from South Eastern Asia (5.4%, a difference of 0.040%), Soviet Union (5.4%, a difference of 0.080%), Immigrants from Israel (5.4%, a difference of 0.10%), and Hawaiian (5.4%, a difference of 0.12%).
| Demographics | Rating | Rank | Female Unemployment |
| Colombians | 27.0 /100 | #194 | Fair 5.3% |
| Immigrants | Colombia | 26.2 /100 | #195 | Fair 5.3% |
| Spaniards | 25.2 /100 | #196 | Fair 5.3% |
| Alsatians | 23.9 /100 | #197 | Fair 5.3% |
| Tsimshian | 23.1 /100 | #198 | Fair 5.4% |
| Hawaiians | 22.2 /100 | #199 | Fair 5.4% |
| Soviet Union | 21.7 /100 | #200 | Fair 5.4% |
| Immigrants | Middle Africa | 20.8 /100 | #201 | Fair 5.4% |
| Iroquois | 20.8 /100 | #202 | Fair 5.4% |
| Immigrants | South Eastern Asia | 20.3 /100 | #203 | Fair 5.4% |
| Immigrants | Israel | 19.7 /100 | #204 | Poor 5.4% |
| Immigrants | Afghanistan | 18.9 /100 | #205 | Poor 5.4% |
| Immigrants | Brazil | 18.8 /100 | #206 | Poor 5.4% |
| Creek | 15.4 /100 | #207 | Poor 5.4% |
| Immigrants | Costa Rica | 13.7 /100 | #208 | Poor 5.4% |