Argentinean vs Immigrants from Cuba Family Households
COMPARE
Argentinean
Immigrants from Cuba
Family Households
Family Households Comparison
Argentineans
Immigrants from Cuba
65.0%
FAMILY HOUSEHOLDS
95.7/ 100
METRIC RATING
114th/ 347
METRIC RANK
68.2%
FAMILY HOUSEHOLDS
100.0/ 100
METRIC RATING
14th/ 347
METRIC RANK
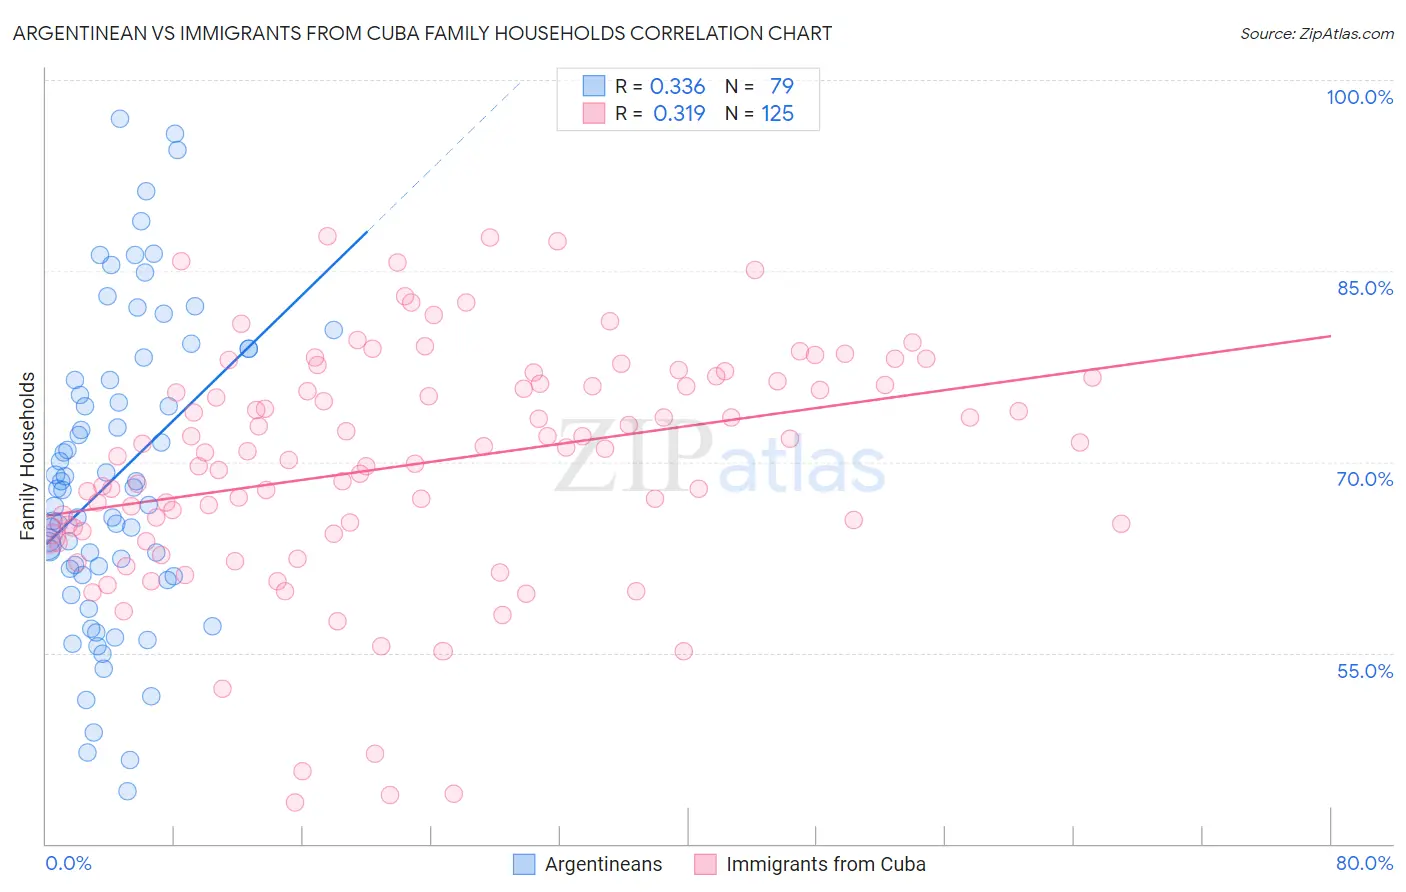
Argentinean vs Immigrants from Cuba Family Households Correlation Chart
The statistical analysis conducted on geographies consisting of 296,998,100 people shows a mild positive correlation between the proportion of Argentineans and percentage of family households in the United States with a correlation coefficient (R) of 0.336 and weighted average of 65.0%. Similarly, the statistical analysis conducted on geographies consisting of 325,966,420 people shows a mild positive correlation between the proportion of Immigrants from Cuba and percentage of family households in the United States with a correlation coefficient (R) of 0.319 and weighted average of 68.2%, a difference of 5.0%.
Family Households Correlation Summary
| Measurement | Argentinean | Immigrants from Cuba |
| Minimum | 44.1% | 43.2% |
| Maximum | 96.9% | 87.7% |
| Range | 52.8% | 44.5% |
| Mean | 68.8% | 69.8% |
| Median | 67.8% | 70.8% |
| Interquartile 25% (IQ1) | 61.1% | 64.5% |
| Interquartile 75% (IQ3) | 76.5% | 76.2% |
| Interquartile Range (IQR) | 15.4% | 11.8% |
| Standard Deviation (Sample) | 11.9% | 9.2% |
| Standard Deviation (Population) | 11.8% | 9.1% |
Similar Demographics by Family Households
Demographics Similar to Argentineans by Family Households
In terms of family households, the demographic groups most similar to Argentineans are Ecuadorian (65.0%, a difference of 0.030%), Immigrants from Iraq (65.0%, a difference of 0.030%), Cherokee (65.0%, a difference of 0.030%), Spanish (65.0%, a difference of 0.040%), and Dutch (64.9%, a difference of 0.050%).
| Demographics | Rating | Rank | Family Households |
| Alaska Natives | 97.3 /100 | #107 | Exceptional 65.1% |
| Palestinians | 97.2 /100 | #108 | Exceptional 65.1% |
| Immigrants | Guatemala | 96.9 /100 | #109 | Exceptional 65.0% |
| Scandinavians | 96.8 /100 | #110 | Exceptional 65.0% |
| Europeans | 96.8 /100 | #111 | Exceptional 65.0% |
| Immigrants | Jordan | 96.5 /100 | #112 | Exceptional 65.0% |
| Spanish | 96.2 /100 | #113 | Exceptional 65.0% |
| Argentineans | 95.7 /100 | #114 | Exceptional 65.0% |
| Ecuadorians | 95.4 /100 | #115 | Exceptional 65.0% |
| Immigrants | Iraq | 95.4 /100 | #116 | Exceptional 65.0% |
| Cherokee | 95.3 /100 | #117 | Exceptional 65.0% |
| Dutch | 95.1 /100 | #118 | Exceptional 64.9% |
| Immigrants | Eastern Asia | 94.4 /100 | #119 | Exceptional 64.9% |
| Immigrants | Oceania | 94.2 /100 | #120 | Exceptional 64.9% |
| Hungarians | 94.0 /100 | #121 | Exceptional 64.9% |
Demographics Similar to Immigrants from Cuba by Family Households
In terms of family households, the demographic groups most similar to Immigrants from Cuba are Pueblo (68.2%, a difference of 0.010%), Assyrian/Chaldean/Syriac (68.2%, a difference of 0.060%), Immigrants from Vietnam (68.2%, a difference of 0.060%), Korean (68.3%, a difference of 0.090%), and Chinese (68.1%, a difference of 0.10%).
| Demographics | Rating | Rank | Family Households |
| Mexicans | 100.0 /100 | #7 | Exceptional 69.0% |
| Immigrants | Fiji | 100.0 /100 | #8 | Exceptional 68.8% |
| Native Hawaiians | 100.0 /100 | #9 | Exceptional 68.4% |
| Immigrants | Philippines | 100.0 /100 | #10 | Exceptional 68.3% |
| Immigrants | Central America | 100.0 /100 | #11 | Exceptional 68.3% |
| Koreans | 100.0 /100 | #12 | Exceptional 68.3% |
| Pueblo | 100.0 /100 | #13 | Exceptional 68.2% |
| Immigrants | Cuba | 100.0 /100 | #14 | Exceptional 68.2% |
| Assyrians/Chaldeans/Syriacs | 100.0 /100 | #15 | Exceptional 68.2% |
| Immigrants | Vietnam | 100.0 /100 | #16 | Exceptional 68.2% |
| Chinese | 100.0 /100 | #17 | Exceptional 68.1% |
| Immigrants | Taiwan | 100.0 /100 | #18 | Exceptional 68.0% |
| Samoans | 100.0 /100 | #19 | Exceptional 67.9% |
| Inupiat | 100.0 /100 | #20 | Exceptional 67.8% |
| Cubans | 100.0 /100 | #21 | Exceptional 67.7% |