African vs Slovak Unemployment Among Women with Children Ages 6 to 17 years
COMPARE
African
Slovak
Unemployment Among Women with Children Ages 6 to 17 years
Unemployment Among Women with Children Ages 6 to 17 years Comparison
Africans
Slovaks
10.4%
UNEMPLOYMENT AMONG WOMEN WITH CHILDREN AGES 6 TO 17 YEARS
0.0/ 100
METRIC RATING
312th/ 347
METRIC RANK
9.8%
UNEMPLOYMENT AMONG WOMEN WITH CHILDREN AGES 6 TO 17 YEARS
0.0/ 100
METRIC RATING
282nd/ 347
METRIC RANK
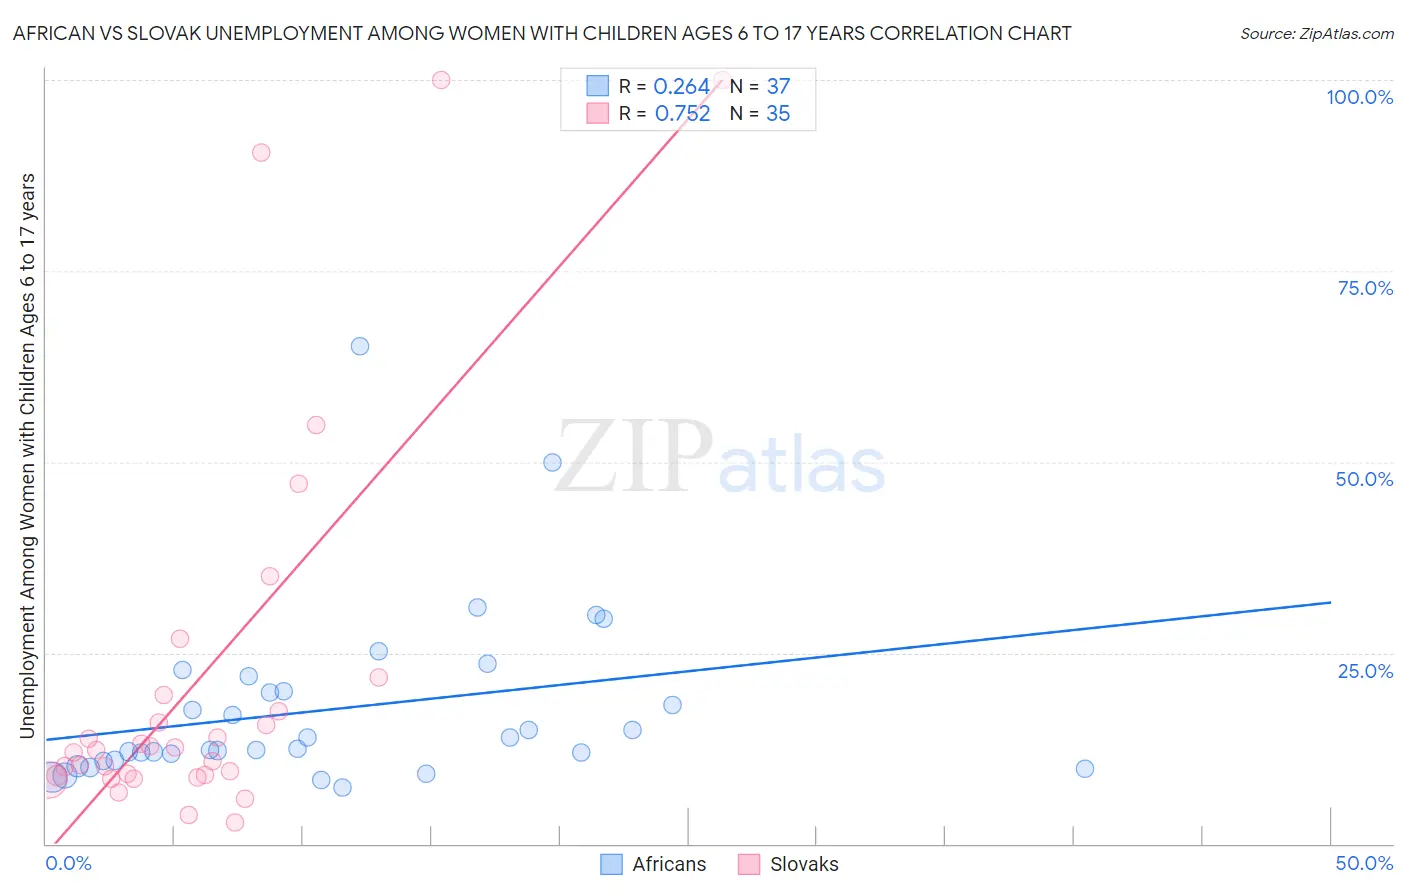
African vs Slovak Unemployment Among Women with Children Ages 6 to 17 years Correlation Chart
The statistical analysis conducted on geographies consisting of 330,667,716 people shows a weak positive correlation between the proportion of Africans and unemployment rate among women with children between the ages 6 and 17 in the United States with a correlation coefficient (R) of 0.264 and weighted average of 10.4%. Similarly, the statistical analysis conducted on geographies consisting of 272,612,741 people shows a strong positive correlation between the proportion of Slovaks and unemployment rate among women with children between the ages 6 and 17 in the United States with a correlation coefficient (R) of 0.752 and weighted average of 9.8%, a difference of 6.2%.
Unemployment Among Women with Children Ages 6 to 17 years Correlation Summary
| Measurement | African | Slovak |
| Minimum | 7.3% | 2.7% |
| Maximum | 65.2% | 100.0% |
| Range | 57.9% | 97.3% |
| Mean | 17.6% | 21.9% |
| Median | 12.5% | 12.3% |
| Interquartile 25% (IQ1) | 10.9% | 8.9% |
| Interquartile 75% (IQ3) | 21.0% | 19.5% |
| Interquartile Range (IQR) | 10.1% | 10.5% |
| Standard Deviation (Sample) | 11.7% | 25.8% |
| Standard Deviation (Population) | 11.5% | 25.4% |
Similar Demographics by Unemployment Among Women with Children Ages 6 to 17 years
Demographics Similar to Africans by Unemployment Among Women with Children Ages 6 to 17 years
In terms of unemployment among women with children ages 6 to 17 years, the demographic groups most similar to Africans are American (10.4%, a difference of 0.18%), Immigrants from Cabo Verde (10.4%, a difference of 0.23%), Bahamian (10.4%, a difference of 0.26%), Immigrants from Liberia (10.3%, a difference of 0.84%), and Alaska Native (10.3%, a difference of 0.87%).
| Demographics | Rating | Rank | Unemployment Among Women with Children Ages 6 to 17 years |
| Immigrants | Nigeria | 0.0 /100 | #305 | Tragic 10.2% |
| Paraguayans | 0.0 /100 | #306 | Tragic 10.2% |
| Immigrants | Senegal | 0.0 /100 | #307 | Tragic 10.2% |
| Dutch West Indians | 0.0 /100 | #308 | Tragic 10.2% |
| French Canadians | 0.0 /100 | #309 | Tragic 10.3% |
| Alaska Natives | 0.0 /100 | #310 | Tragic 10.3% |
| Immigrants | Liberia | 0.0 /100 | #311 | Tragic 10.3% |
| Africans | 0.0 /100 | #312 | Tragic 10.4% |
| Americans | 0.0 /100 | #313 | Tragic 10.4% |
| Immigrants | Cabo Verde | 0.0 /100 | #314 | Tragic 10.4% |
| Bahamians | 0.0 /100 | #315 | Tragic 10.4% |
| Immigrants | Dominica | 0.0 /100 | #316 | Tragic 10.5% |
| Bermudans | 0.0 /100 | #317 | Tragic 10.5% |
| Delaware | 0.0 /100 | #318 | Tragic 10.5% |
| Immigrants | Uganda | 0.0 /100 | #319 | Tragic 10.7% |
Demographics Similar to Slovaks by Unemployment Among Women with Children Ages 6 to 17 years
In terms of unemployment among women with children ages 6 to 17 years, the demographic groups most similar to Slovaks are Jamaican (9.8%, a difference of 0.23%), Seminole (9.7%, a difference of 0.76%), Central American Indian (9.9%, a difference of 0.83%), Scotch-Irish (9.7%, a difference of 0.95%), and Yakama (9.9%, a difference of 0.98%).
| Demographics | Rating | Rank | Unemployment Among Women with Children Ages 6 to 17 years |
| U.S. Virgin Islanders | 0.1 /100 | #275 | Tragic 9.7% |
| Immigrants | Portugal | 0.1 /100 | #276 | Tragic 9.7% |
| British West Indians | 0.1 /100 | #277 | Tragic 9.7% |
| French | 0.1 /100 | #278 | Tragic 9.7% |
| Scotch-Irish | 0.1 /100 | #279 | Tragic 9.7% |
| Seminole | 0.1 /100 | #280 | Tragic 9.7% |
| Jamaicans | 0.0 /100 | #281 | Tragic 9.8% |
| Slovaks | 0.0 /100 | #282 | Tragic 9.8% |
| Central American Indians | 0.0 /100 | #283 | Tragic 9.9% |
| Yakama | 0.0 /100 | #284 | Tragic 9.9% |
| Hispanics or Latinos | 0.0 /100 | #285 | Tragic 9.9% |
| Choctaw | 0.0 /100 | #286 | Tragic 9.9% |
| Sierra Leoneans | 0.0 /100 | #287 | Tragic 9.9% |
| Shoshone | 0.0 /100 | #288 | Tragic 10.0% |
| Hondurans | 0.0 /100 | #289 | Tragic 10.0% |