Smithville, TX Map & Demographics
Smithville Map
Smithville Overview
$40,839
PER CAPITA INCOME
$83,750
AVG FAMILY INCOME
$56,627
AVG HOUSEHOLD INCOME
27.5%
WAGE / INCOME GAP [ % ]
72.5¢/ $1
WAGE / INCOME GAP [ $ ]
0.49
INEQUALITY / GINI INDEX
3,975
TOTAL POPULATION
1,990
MALE POPULATION
1,985
FEMALE POPULATION
100.25
MALES / 100 FEMALES
99.75
FEMALES / 100 MALES
45.7
MEDIAN AGE
2.9
AVG FAMILY SIZE
2.4
AVG HOUSEHOLD SIZE
2,286
LABOR FORCE [ PEOPLE ]
69.6%
PERCENT IN LABOR FORCE
4.5%
UNEMPLOYMENT RATE
Smithville Zip Codes
Income in Smithville
Income Overview in Smithville
Per Capita Income in Smithville is $40,839, while median incomes of families and households are $83,750 and $56,627 respectively.
| Characteristic | Number | Measure |
| Per Capita Income | 3,975 | $40,839 |
| Median Family Income | 1,059 | $83,750 |
| Mean Family Income | 1,059 | $102,668 |
| Median Household Income | 1,666 | $56,627 |
| Mean Household Income | 1,666 | $90,129 |
| Income Deficit | 1,059 | $0 |
| Wage / Income Gap (%) | 3,975 | 27.47% |
| Wage / Income Gap ($) | 3,975 | 72.53¢ per $1 |
| Gini / Inequality Index | 3,975 | 0.49 |
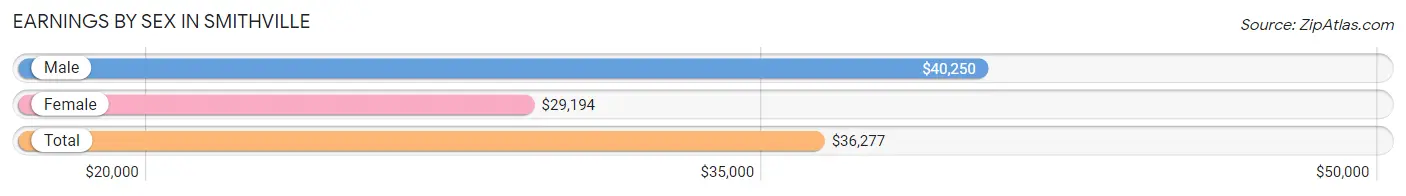
Earnings by Sex in Smithville
Average Earnings in Smithville are $36,277, $40,250 for men and $29,194 for women, a difference of 27.5%.
| Sex | Number | Average Earnings |
| Male | 1,275 (54.6%) | $40,250 |
| Female | 1,058 (45.4%) | $29,194 |
| Total | 2,333 (100.0%) | $36,277 |
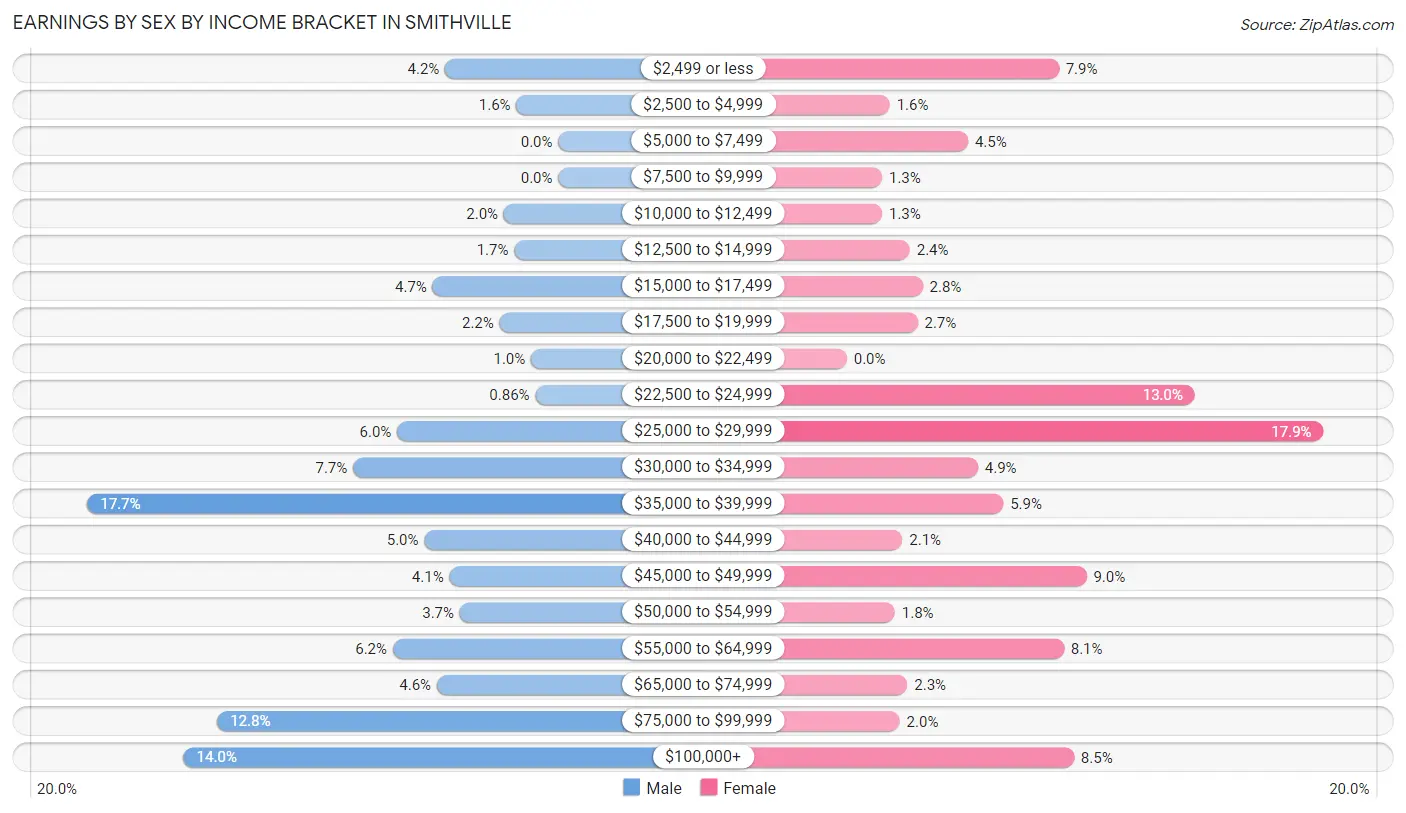
Earnings by Sex by Income Bracket in Smithville
The most common earnings brackets in Smithville are $35,000 to $39,999 for men (225 | 17.6%) and $25,000 to $29,999 for women (189 | 17.9%).
| Income | Male | Female |
| $2,499 or less | 54 (4.2%) | 84 (7.9%) |
| $2,500 to $4,999 | 20 (1.6%) | 17 (1.6%) |
| $5,000 to $7,499 | 0 (0.0%) | 48 (4.5%) |
| $7,500 to $9,999 | 0 (0.0%) | 14 (1.3%) |
| $10,000 to $12,499 | 26 (2.0%) | 14 (1.3%) |
| $12,500 to $14,999 | 21 (1.7%) | 25 (2.4%) |
| $15,000 to $17,499 | 60 (4.7%) | 30 (2.8%) |
| $17,500 to $19,999 | 28 (2.2%) | 28 (2.6%) |
| $20,000 to $22,499 | 13 (1.0%) | 0 (0.0%) |
| $22,500 to $24,999 | 11 (0.9%) | 138 (13.0%) |
| $25,000 to $29,999 | 77 (6.0%) | 189 (17.9%) |
| $30,000 to $34,999 | 98 (7.7%) | 52 (4.9%) |
| $35,000 to $39,999 | 225 (17.6%) | 62 (5.9%) |
| $40,000 to $44,999 | 64 (5.0%) | 22 (2.1%) |
| $45,000 to $49,999 | 52 (4.1%) | 95 (9.0%) |
| $50,000 to $54,999 | 47 (3.7%) | 19 (1.8%) |
| $55,000 to $64,999 | 79 (6.2%) | 86 (8.1%) |
| $65,000 to $74,999 | 58 (4.5%) | 24 (2.3%) |
| $75,000 to $99,999 | 163 (12.8%) | 21 (2.0%) |
| $100,000+ | 179 (14.0%) | 90 (8.5%) |
| Total | 1,275 (100.0%) | 1,058 (100.0%) |
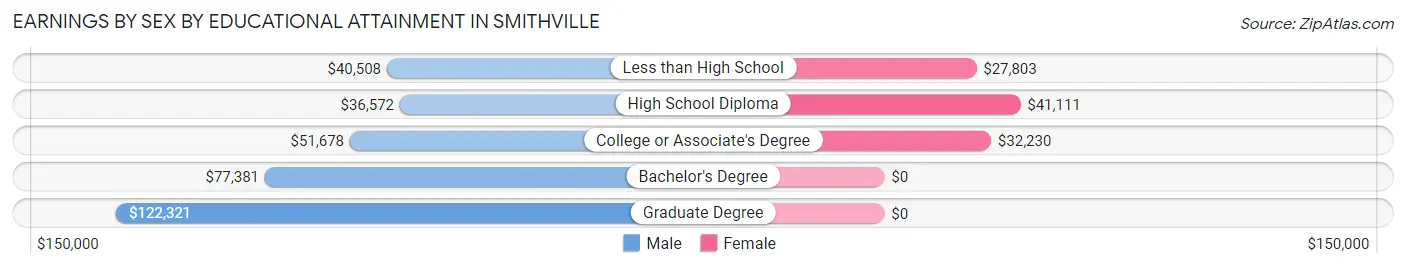
Earnings by Sex by Educational Attainment in Smithville
Average earnings in Smithville are $47,668 for men and $30,889 for women, a difference of 35.2%. Men with an educational attainment of graduate degree enjoy the highest average annual earnings of $122,321, while those with high school diploma education earn the least with $36,572. Women with an educational attainment of high school diploma earn the most with the average annual earnings of $41,111, while those with less than high school education have the smallest earnings of $27,803.
| Educational Attainment | Male Income | Female Income |
| Less than High School | $40,508 | $27,803 |
| High School Diploma | $36,572 | $41,111 |
| College or Associate's Degree | $51,678 | $32,230 |
| Bachelor's Degree | $77,381 | $0 |
| Graduate Degree | $122,321 | $0 |
| Total | $47,668 | $30,889 |
Family Income in Smithville
Family Income Brackets in Smithville
According to the Smithville family income data, there are 226 families falling into the $50,000 to $74,999 income range, which is the most common income bracket and makes up 21.3% of all families.
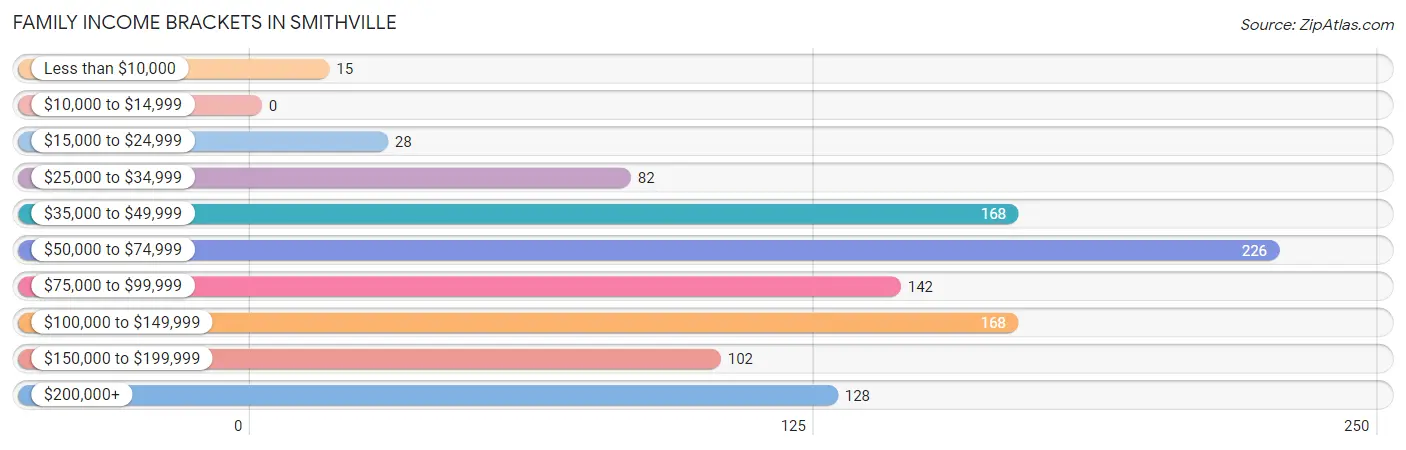
| Income Bracket | # Families | % Families |
| Less than $10,000 | 15 | 1.4% |
| $10,000 to $14,999 | 0 | 0.0% |
| $15,000 to $24,999 | 28 | 2.6% |
| $25,000 to $34,999 | 82 | 7.7% |
| $35,000 to $49,999 | 168 | 15.9% |
| $50,000 to $74,999 | 226 | 21.3% |
| $75,000 to $99,999 | 142 | 13.4% |
| $100,000 to $149,999 | 168 | 15.9% |
| $150,000 to $199,999 | 102 | 9.6% |
| $200,000+ | 128 | 12.1% |
Family Income by Famaliy Size in Smithville
5-person families (67 | 6.3%) account for the highest median family income in Smithville with $161,367 per family, while 5-person families (67 | 6.3%) have the highest median income of $32,273 per family member.
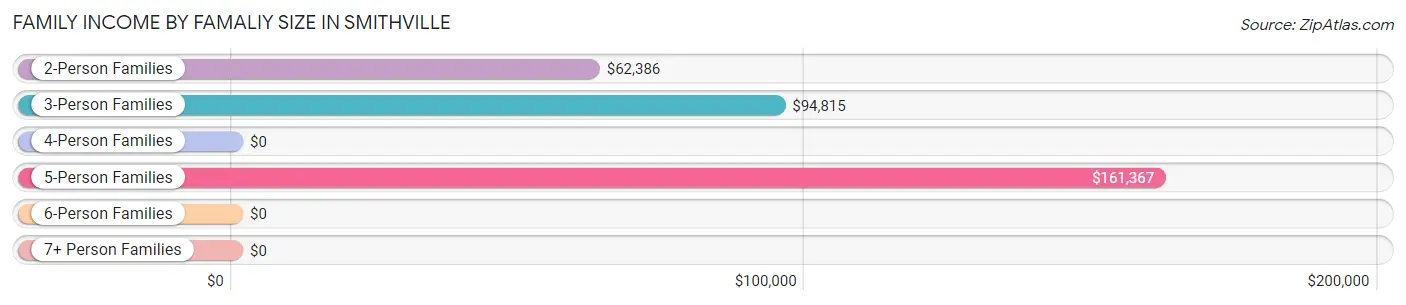
| Income Bracket | # Families | Median Income |
| 2-Person Families | 605 (57.1%) | $62,386 |
| 3-Person Families | 268 (25.3%) | $94,815 |
| 4-Person Families | 109 (10.3%) | $0 |
| 5-Person Families | 67 (6.3%) | $161,367 |
| 6-Person Families | 10 (0.9%) | $0 |
| 7+ Person Families | 0 (0.0%) | $0 |
| Total | 1,059 (100.0%) | $83,750 |
Family Income by Number of Earners in Smithville
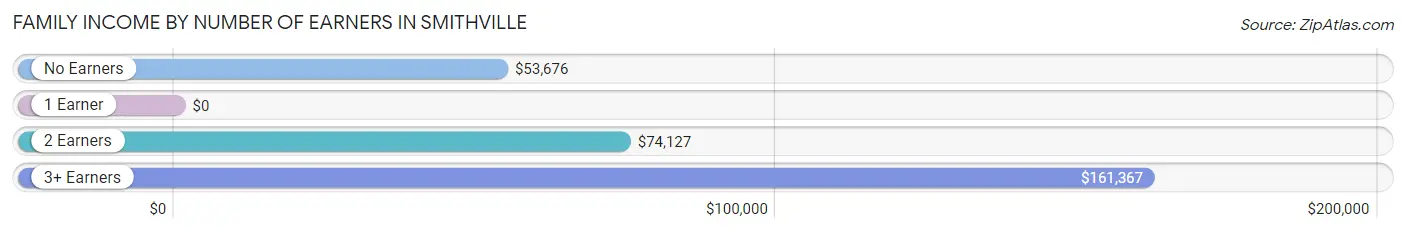
| Number of Earners | # Families | Median Income |
| No Earners | 172 (16.2%) | $53,676 |
| 1 Earner | 319 (30.1%) | $0 |
| 2 Earners | 431 (40.7%) | $74,127 |
| 3+ Earners | 137 (12.9%) | $161,367 |
| Total | 1,059 (100.0%) | $83,750 |
Household Income in Smithville
Household Income Brackets in Smithville
With 353 households falling in the category, the $35,000 to $49,999 income range is the most frequent in Smithville, accounting for 21.2% of all households. In contrast, only 50 households (3.0%) fall into the less than $10,000 income bracket, making it the least populous group.
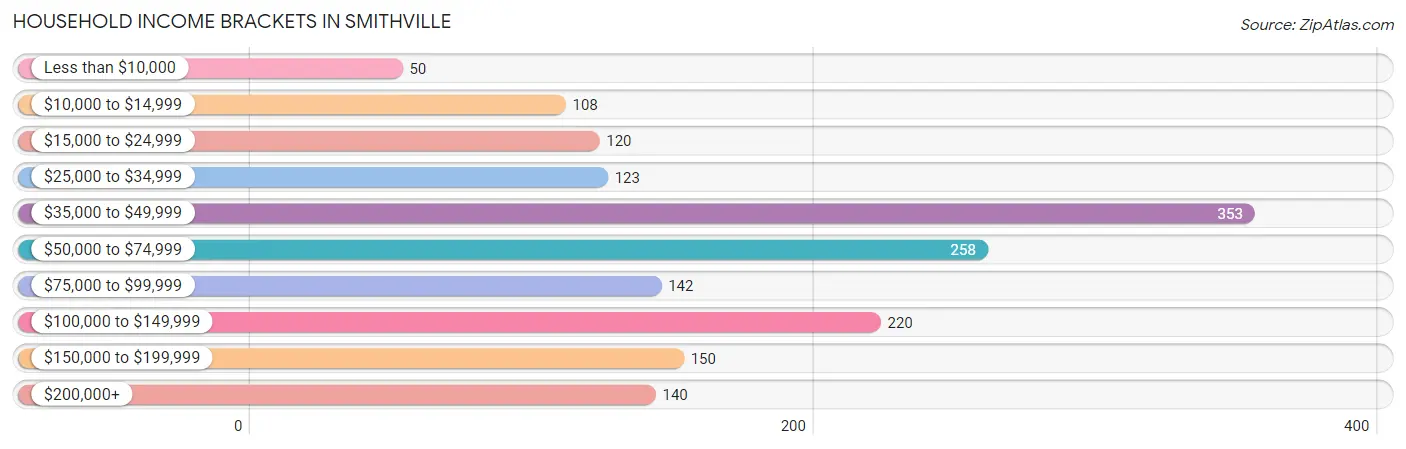
| Income Bracket | # Households | % Households |
| Less than $10,000 | 50 | 3.0% |
| $10,000 to $14,999 | 108 | 6.5% |
| $15,000 to $24,999 | 120 | 7.2% |
| $25,000 to $34,999 | 123 | 7.4% |
| $35,000 to $49,999 | 353 | 21.2% |
| $50,000 to $74,999 | 258 | 15.5% |
| $75,000 to $99,999 | 142 | 8.5% |
| $100,000 to $149,999 | 220 | 13.2% |
| $150,000 to $199,999 | 150 | 9.0% |
| $200,000+ | 140 | 8.4% |
Household Income by Householder Age in Smithville
The median household income in Smithville is $56,627, with the highest median household income of $101,635 found in the 25 to 44 years age bracket for the primary householder. A total of 409 households (24.5%) fall into this category. Meanwhile, the 65+ years age bracket for the primary householder has the lowest median household income of $40,458, with 566 households (34.0%) in this group.
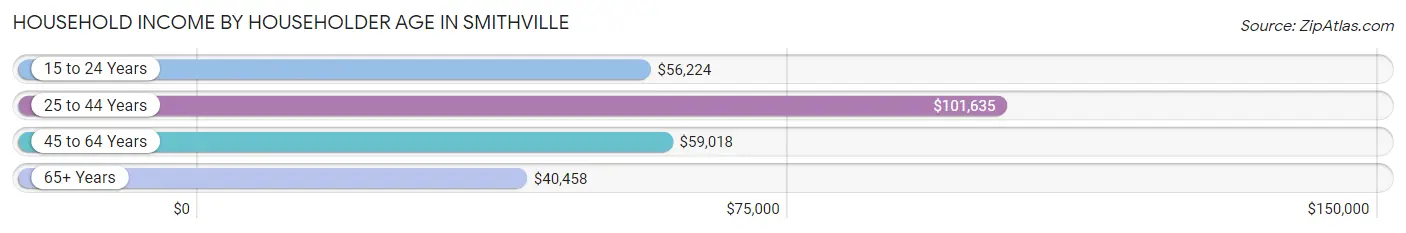
| Income Bracket | # Households | Median Income |
| 15 to 24 Years | 75 (4.5%) | $56,224 |
| 25 to 44 Years | 409 (24.5%) | $101,635 |
| 45 to 64 Years | 616 (37.0%) | $59,018 |
| 65+ Years | 566 (34.0%) | $40,458 |
| Total | 1,666 (100.0%) | $56,627 |
Poverty in Smithville
Income Below Poverty by Sex and Age in Smithville
With 8.7% poverty level for males and 6.1% for females among the residents of Smithville, 5 year old males and 75 year old and over females are the most vulnerable to poverty, with 22 males (71.0%) and 30 females (16.2%) in their respective age groups living below the poverty level.
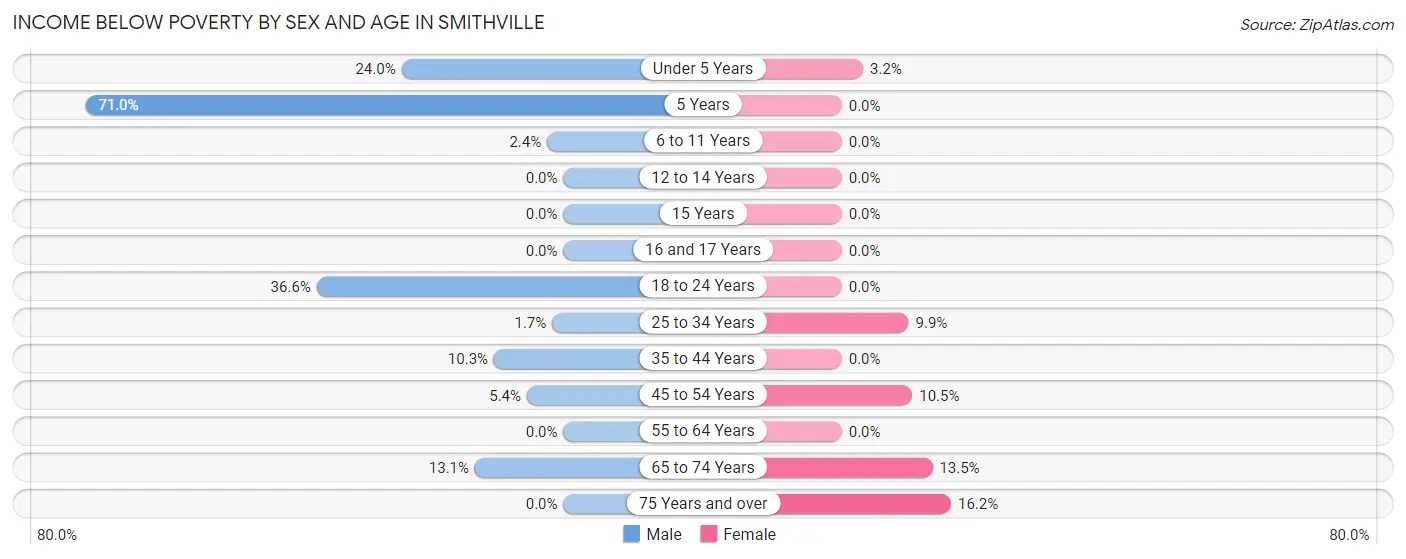
| Age Bracket | Male | Female |
| Under 5 Years | 25 (24.0%) | 3 (3.2%) |
| 5 Years | 22 (71.0%) | 0 (0.0%) |
| 6 to 11 Years | 4 (2.4%) | 0 (0.0%) |
| 12 to 14 Years | 0 (0.0%) | 0 (0.0%) |
| 15 Years | 0 (0.0%) | 0 (0.0%) |
| 16 and 17 Years | 0 (0.0%) | 0 (0.0%) |
| 18 to 24 Years | 37 (36.6%) | 0 (0.0%) |
| 25 to 34 Years | 3 (1.7%) | 24 (9.9%) |
| 35 to 44 Years | 30 (10.3%) | 0 (0.0%) |
| 45 to 54 Years | 29 (5.4%) | 27 (10.5%) |
| 55 to 64 Years | 0 (0.0%) | 0 (0.0%) |
| 65 to 74 Years | 23 (13.1%) | 35 (13.5%) |
| 75 Years and over | 0 (0.0%) | 30 (16.2%) |
| Total | 173 (8.7%) | 119 (6.1%) |
Income Above Poverty by Sex and Age in Smithville
According to the poverty statistics in Smithville, males aged 12 to 14 years and females aged 6 to 11 years are the age groups that are most secure financially, with 100.0% of males and 100.0% of females in these age groups living above the poverty line.
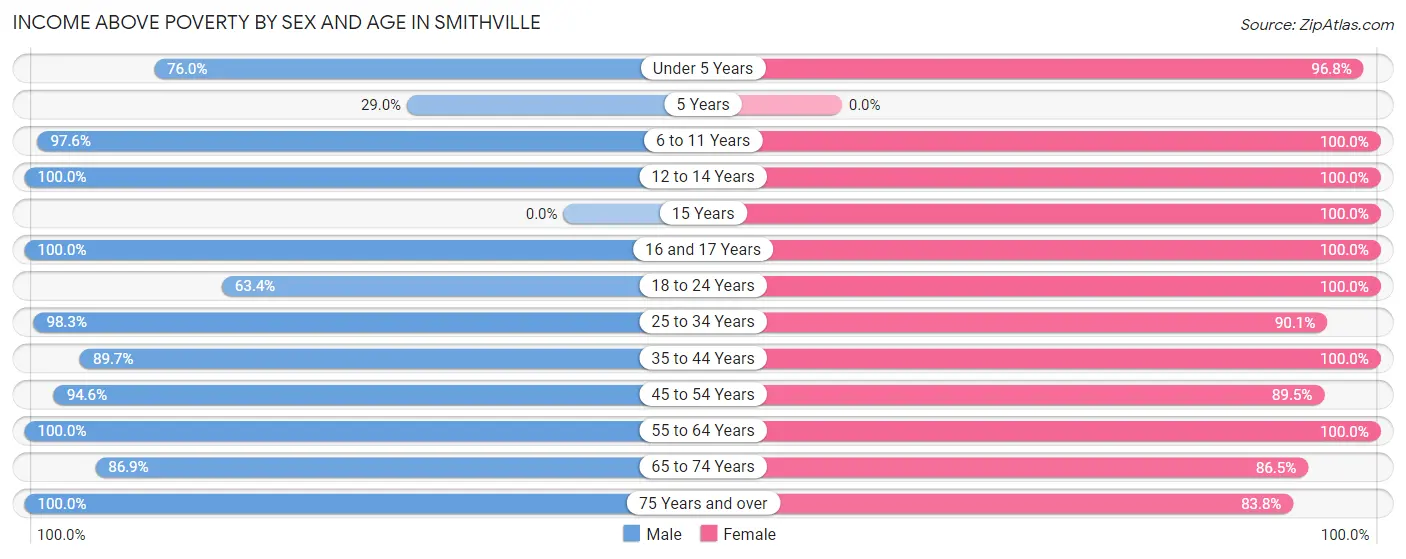
| Age Bracket | Male | Female |
| Under 5 Years | 79 (76.0%) | 92 (96.8%) |
| 5 Years | 9 (29.0%) | 0 (0.0%) |
| 6 to 11 Years | 161 (97.6%) | 136 (100.0%) |
| 12 to 14 Years | 45 (100.0%) | 40 (100.0%) |
| 15 Years | 0 (0.0%) | 75 (100.0%) |
| 16 and 17 Years | 33 (100.0%) | 37 (100.0%) |
| 18 to 24 Years | 64 (63.4%) | 116 (100.0%) |
| 25 to 34 Years | 177 (98.3%) | 218 (90.1%) |
| 35 to 44 Years | 261 (89.7%) | 261 (100.0%) |
| 45 to 54 Years | 506 (94.6%) | 231 (89.5%) |
| 55 to 64 Years | 105 (100.0%) | 251 (100.0%) |
| 65 to 74 Years | 152 (86.9%) | 225 (86.5%) |
| 75 Years and over | 214 (100.0%) | 155 (83.8%) |
| Total | 1,806 (91.3%) | 1,837 (93.9%) |
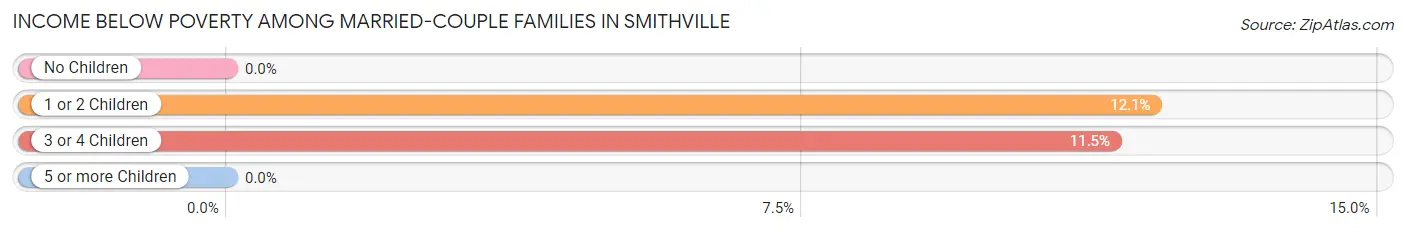
Income Below Poverty Among Married-Couple Families in Smithville
The poverty statistics for married-couple families in Smithville show that 3.6% or 31 of the total 860 families live below the poverty line. Families with 1 or 2 children have the highest poverty rate of 12.1%, comprising of 28 families. On the other hand, families with no children have the lowest poverty rate of 0.0%, which includes 0 families.
| Children | Above Poverty | Below Poverty |
| No Children | 602 (100.0%) | 0 (0.0%) |
| 1 or 2 Children | 204 (87.9%) | 28 (12.1%) |
| 3 or 4 Children | 23 (88.5%) | 3 (11.5%) |
| 5 or more Children | 0 (0.0%) | 0 (0.0%) |
| Total | 829 (96.4%) | 31 (3.6%) |
Income Below Poverty Among Single-Parent Households in Smithville
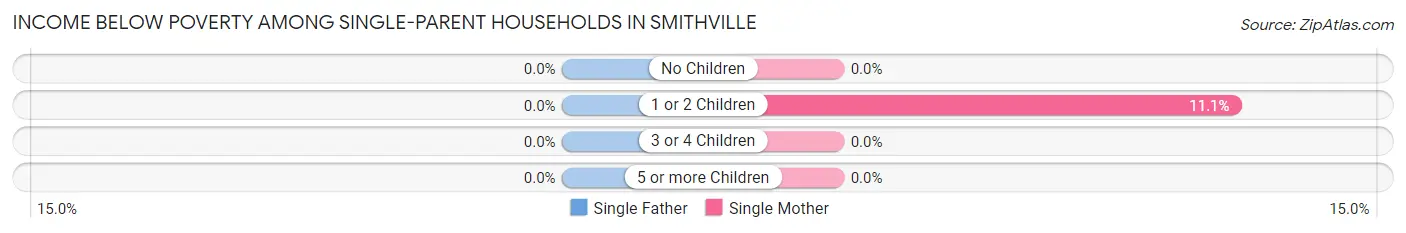
| Children | Single Father | Single Mother |
| No Children | 0 (0.0%) | 0 (0.0%) |
| 1 or 2 Children | 0 (0.0%) | 15 (11.1%) |
| 3 or 4 Children | 0 (0.0%) | 0 (0.0%) |
| 5 or more Children | 0 (0.0%) | 0 (0.0%) |
| Total | 0 (0.0%) | 15 (7.5%) |
Income Below Poverty Among Married-Couple vs Single-Parent Households in Smithville
The poverty data for Smithville shows that 31 of the married-couple family households (3.6%) and 15 of the single-parent households (7.5%) are living below the poverty level. Within the married-couple family households, those with 1 or 2 children have the highest poverty rate, with 28 households (12.1%) falling below the poverty line. Among the single-parent households, those with 1 or 2 children have the highest poverty rate, with 15 household (11.1%) living below poverty.
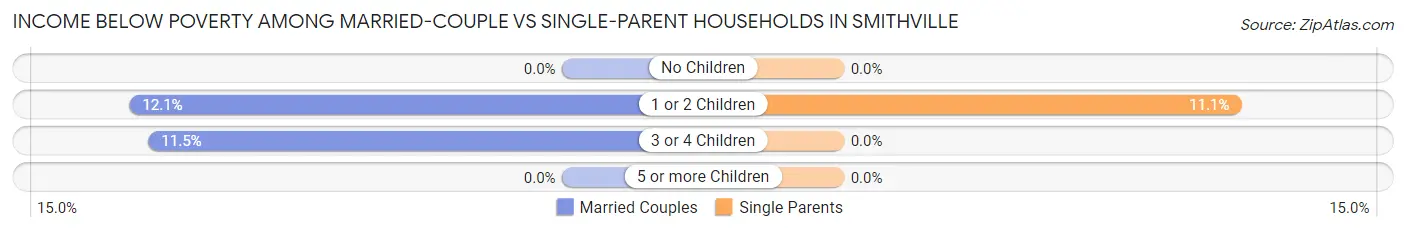
| Children | Married-Couple Families | Single-Parent Households |
| No Children | 0 (0.0%) | 0 (0.0%) |
| 1 or 2 Children | 28 (12.1%) | 15 (11.1%) |
| 3 or 4 Children | 3 (11.5%) | 0 (0.0%) |
| 5 or more Children | 0 (0.0%) | 0 (0.0%) |
| Total | 31 (3.6%) | 15 (7.5%) |
Race in Smithville
The most populous races in Smithville are White / Caucasian (2,968 | 74.7%), Hispanic or Latino (634 | 16.0%), and Two or more Races (412 | 10.4%).
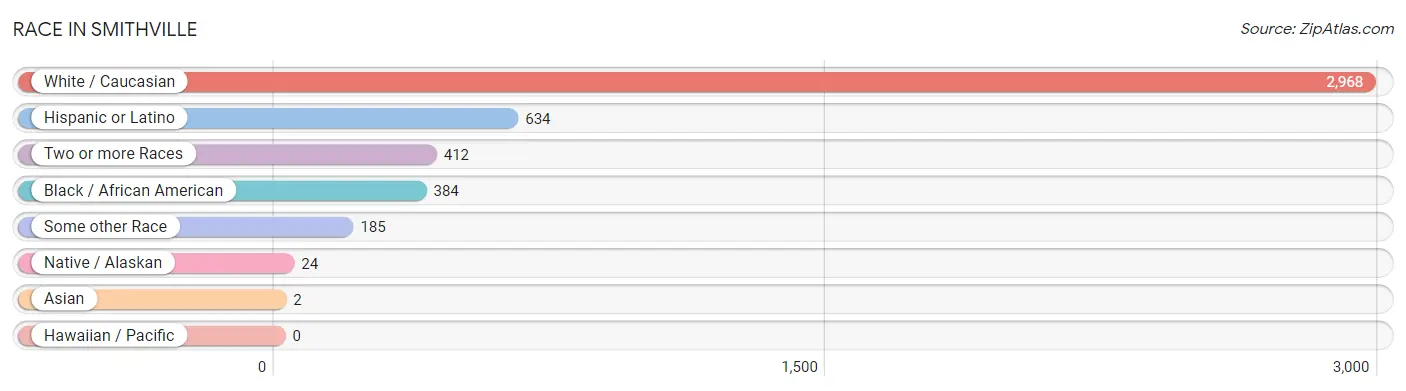
| Race | # Population | % Population |
| Asian | 2 | 0.1% |
| Black / African American | 384 | 9.7% |
| Hawaiian / Pacific | 0 | 0.0% |
| Hispanic or Latino | 634 | 16.0% |
| Native / Alaskan | 24 | 0.6% |
| White / Caucasian | 2,968 | 74.7% |
| Two or more Races | 412 | 10.4% |
| Some other Race | 185 | 4.6% |
| Total | 3,975 | 100.0% |
Ancestry in Smithville
The most populous ancestries reported in Smithville are English (719 | 18.1%), German (719 | 18.1%), Irish (647 | 16.3%), Mexican (583 | 14.7%), and Scottish (240 | 6.0%), together accounting for 73.2% of all Smithville residents.
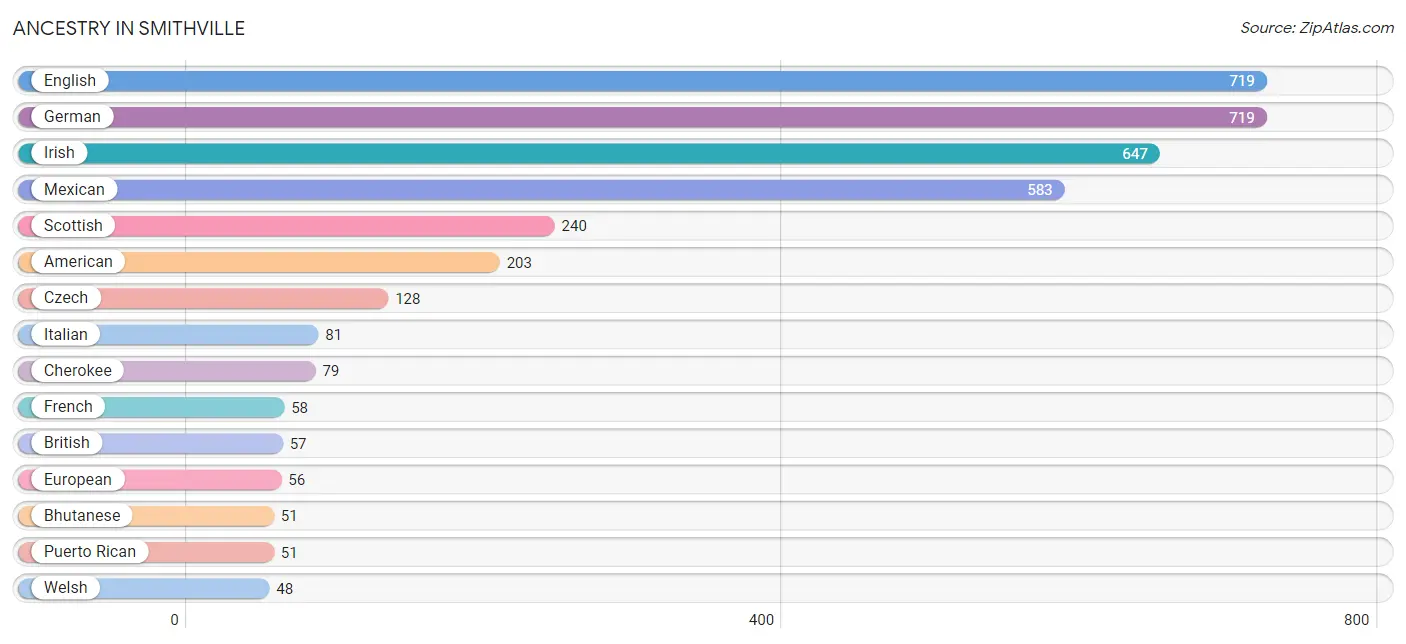
| Ancestry | # Population | % Population |
| American | 203 | 5.1% |
| Austrian | 11 | 0.3% |
| Bhutanese | 51 | 1.3% |
| British | 57 | 1.4% |
| Cherokee | 79 | 2.0% |
| Choctaw | 11 | 0.3% |
| Czech | 128 | 3.2% |
| Danish | 13 | 0.3% |
| Dutch | 43 | 1.1% |
| English | 719 | 18.1% |
| European | 56 | 1.4% |
| French | 58 | 1.5% |
| German | 719 | 18.1% |
| Greek | 36 | 0.9% |
| Hungarian | 22 | 0.5% |
| Irish | 647 | 16.3% |
| Italian | 81 | 2.0% |
| Lithuanian | 13 | 0.3% |
| Mexican | 583 | 14.7% |
| Polish | 28 | 0.7% |
| Portuguese | 37 | 0.9% |
| Puerto Rican | 51 | 1.3% |
| Scotch-Irish | 33 | 0.8% |
| Scottish | 240 | 6.0% |
| Sri Lankan | 2 | 0.1% |
| Welsh | 48 | 1.2% | View All 26 Rows |
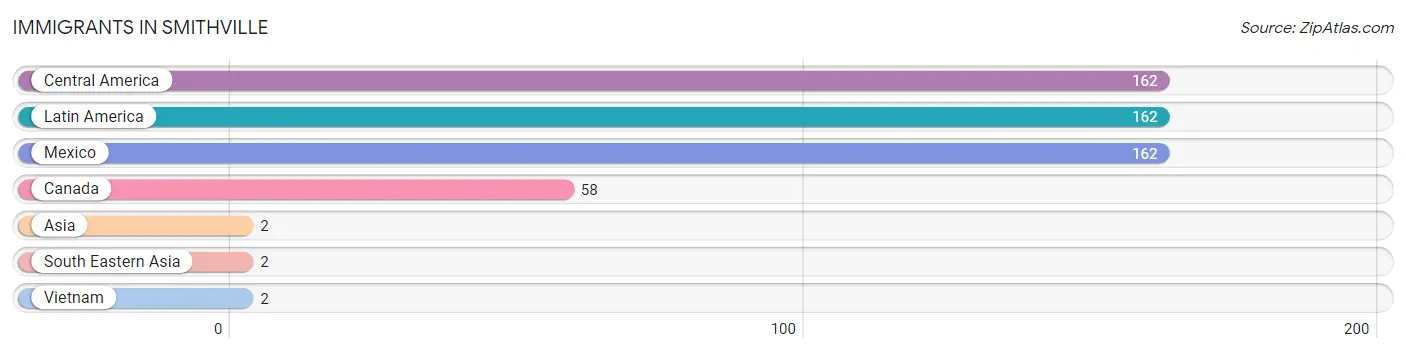
Immigrants in Smithville
The most numerous immigrant groups reported in Smithville came from Central America (162 | 4.1%), Latin America (162 | 4.1%), Mexico (162 | 4.1%), Canada (58 | 1.5%), and Asia (2 | 0.1%), together accounting for 13.8% of all Smithville residents.
| Immigration Origin | # Population | % Population |
| Asia | 2 | 0.1% |
| Canada | 58 | 1.5% |
| Central America | 162 | 4.1% |
| Latin America | 162 | 4.1% |
| Mexico | 162 | 4.1% |
| South Eastern Asia | 2 | 0.1% |
| Vietnam | 2 | 0.1% | View All 7 Rows |
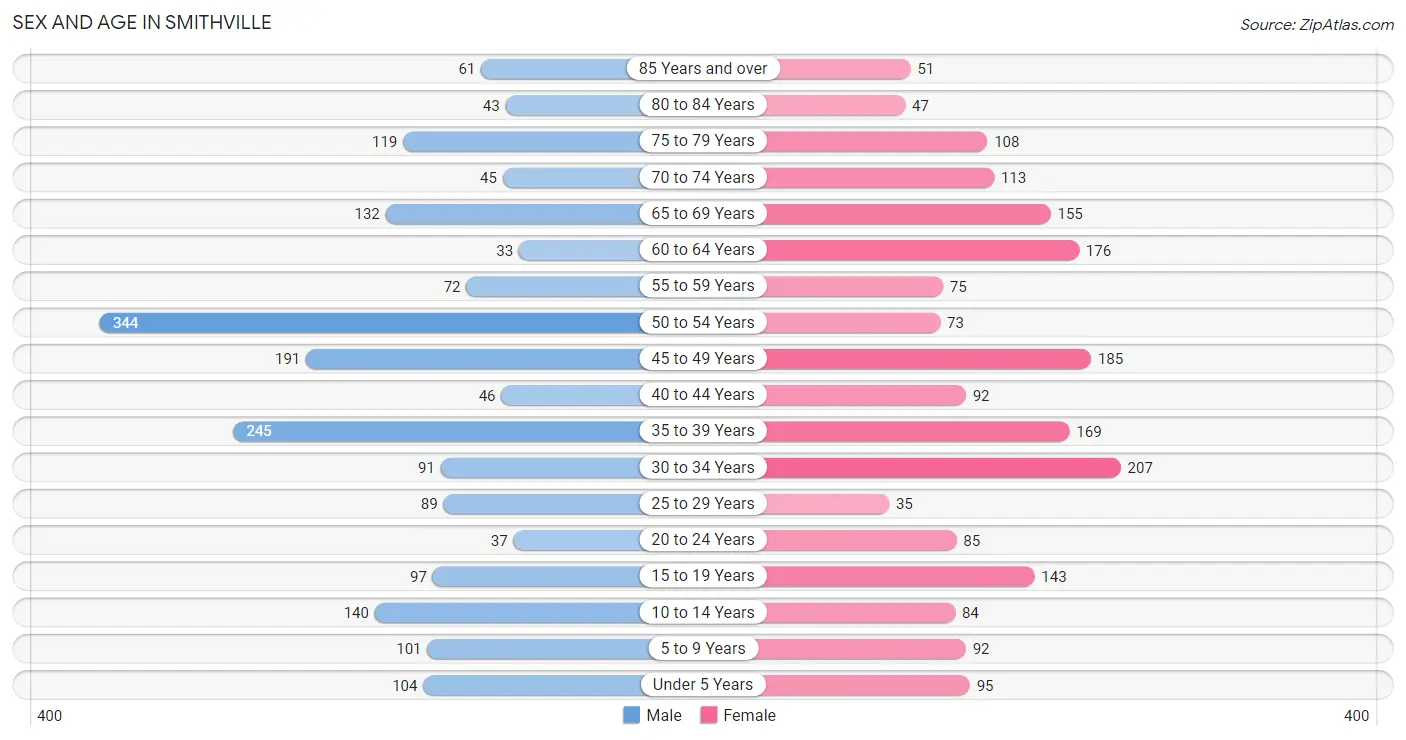
Sex and Age in Smithville
Sex and Age in Smithville
The most populous age groups in Smithville are 50 to 54 Years (344 | 17.3%) for men and 30 to 34 Years (207 | 10.4%) for women.
| Age Bracket | Male | Female |
| Under 5 Years | 104 (5.2%) | 95 (4.8%) |
| 5 to 9 Years | 101 (5.1%) | 92 (4.6%) |
| 10 to 14 Years | 140 (7.0%) | 84 (4.2%) |
| 15 to 19 Years | 97 (4.9%) | 143 (7.2%) |
| 20 to 24 Years | 37 (1.9%) | 85 (4.3%) |
| 25 to 29 Years | 89 (4.5%) | 35 (1.8%) |
| 30 to 34 Years | 91 (4.6%) | 207 (10.4%) |
| 35 to 39 Years | 245 (12.3%) | 169 (8.5%) |
| 40 to 44 Years | 46 (2.3%) | 92 (4.6%) |
| 45 to 49 Years | 191 (9.6%) | 185 (9.3%) |
| 50 to 54 Years | 344 (17.3%) | 73 (3.7%) |
| 55 to 59 Years | 72 (3.6%) | 75 (3.8%) |
| 60 to 64 Years | 33 (1.7%) | 176 (8.9%) |
| 65 to 69 Years | 132 (6.6%) | 155 (7.8%) |
| 70 to 74 Years | 45 (2.3%) | 113 (5.7%) |
| 75 to 79 Years | 119 (6.0%) | 108 (5.4%) |
| 80 to 84 Years | 43 (2.2%) | 47 (2.4%) |
| 85 Years and over | 61 (3.1%) | 51 (2.6%) |
| Total | 1,990 (100.0%) | 1,985 (100.0%) |
Families and Households in Smithville
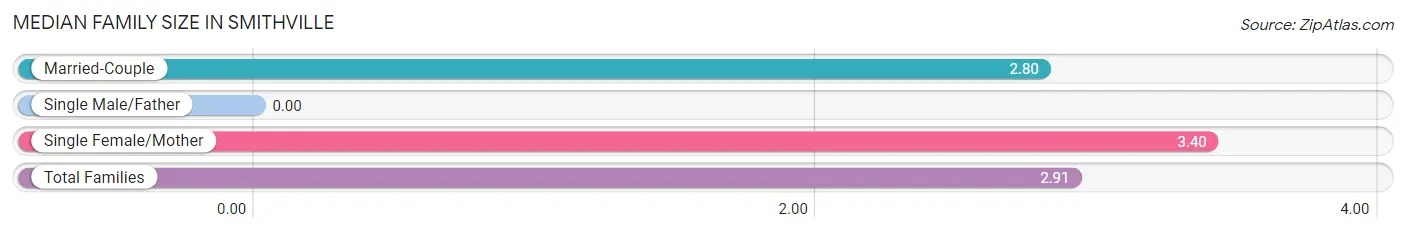
Median Family Size in Smithville
| Family Type | # Families | Family Size |
| Married-Couple | 860 (81.2%) | 2.80 |
| Single Male/Father | 0 (0.0%) | - |
| Single Female/Mother | 199 (18.8%) | 3.40 |
| Total Families | 1,059 (100.0%) | 2.91 |
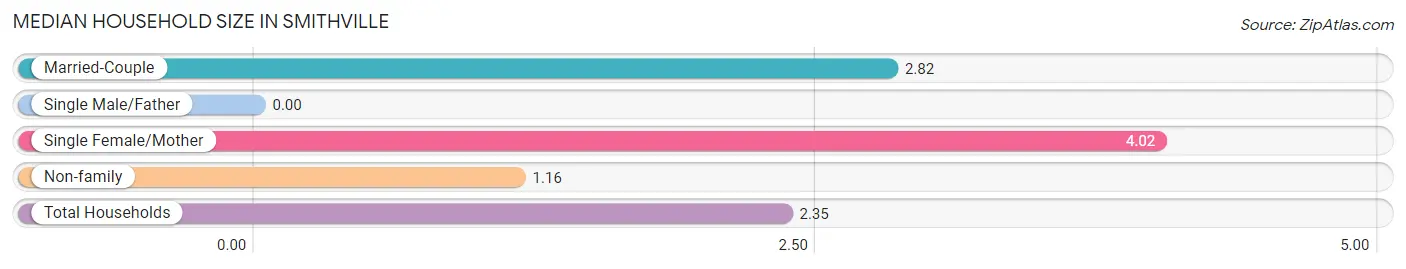
Median Household Size in Smithville
| Household Type | # Households | Household Size |
| Married-Couple | 860 (51.6%) | 2.82 |
| Single Male/Father | 0 (0.0%) | - |
| Single Female/Mother | 199 (11.9%) | 4.02 |
| Non-family | 607 (36.4%) | 1.16 |
| Total Households | 1,666 (100.0%) | 2.35 |
Household Size by Marriage Status in Smithville
Out of a total of 1,666 households in Smithville, 1,059 (63.6%) are family households, while 607 (36.4%) are nonfamily households. The most numerous type of family households are 2-person households, comprising 590, and the most common type of nonfamily households are 1-person households, comprising 531.
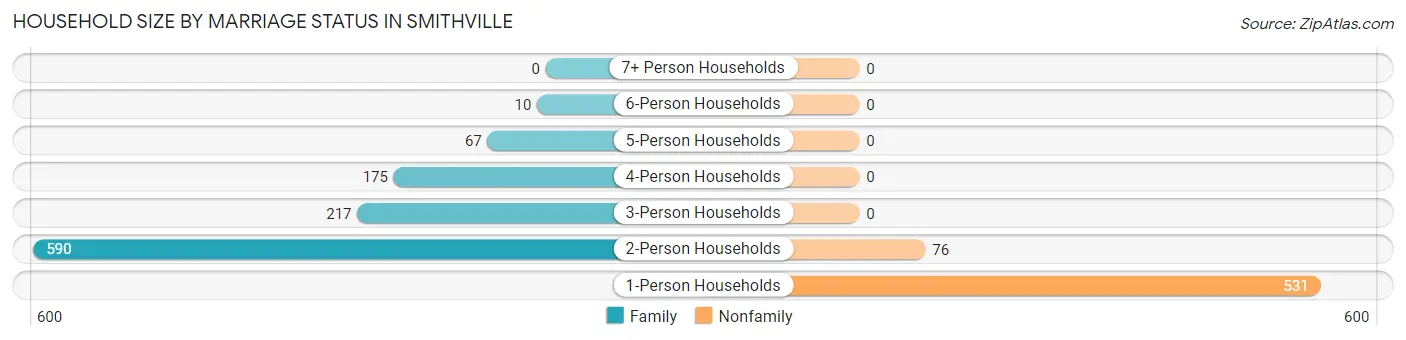
| Household Size | Family Households | Nonfamily Households |
| 1-Person Households | - | 531 (31.9%) |
| 2-Person Households | 590 (35.4%) | 76 (4.6%) |
| 3-Person Households | 217 (13.0%) | 0 (0.0%) |
| 4-Person Households | 175 (10.5%) | 0 (0.0%) |
| 5-Person Households | 67 (4.0%) | 0 (0.0%) |
| 6-Person Households | 10 (0.6%) | 0 (0.0%) |
| 7+ Person Households | 0 (0.0%) | 0 (0.0%) |
| Total | 1,059 (63.6%) | 607 (36.4%) |
Female Fertility in Smithville
Fertility by Age in Smithville
Average fertility rate in Smithville is 36.0 births per 1,000 women. Women in the age bracket of 20 to 34 years have the highest fertility rate with 52.0 births per 1,000 women. Women in the age bracket of 20 to 34 years acount for 51.5% of all women with births.
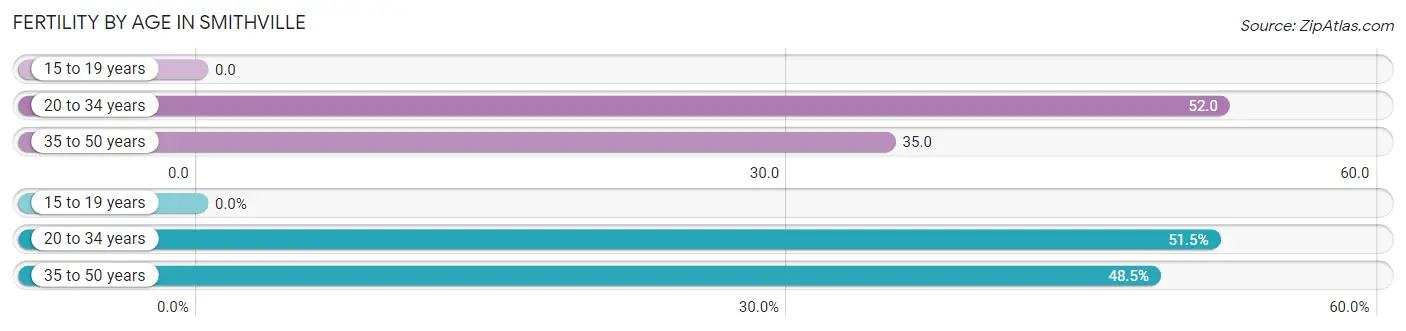
| Age Bracket | Women with Births | Births / 1,000 Women |
| 15 to 19 years | 0 (0.0%) | 0.0 |
| 20 to 34 years | 17 (51.5%) | 52.0 |
| 35 to 50 years | 16 (48.5%) | 35.0 |
| Total | 33 (100.0%) | 36.0 |
Fertility by Age by Marriage Status in Smithville
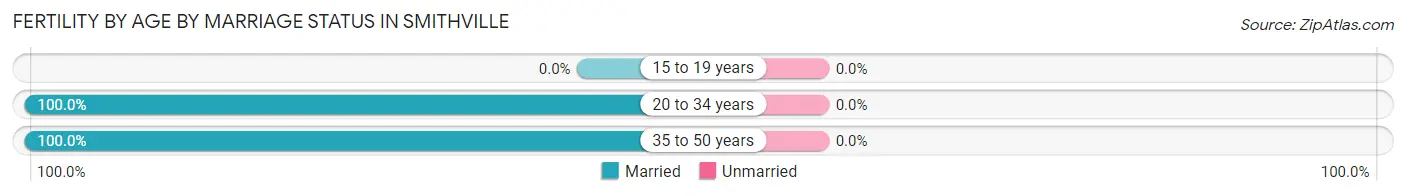
| Age Bracket | Married | Unmarried |
| 15 to 19 years | 0 (0.0%) | 0 (0.0%) |
| 20 to 34 years | 17 (100.0%) | 0 (0.0%) |
| 35 to 50 years | 16 (100.0%) | 0 (0.0%) |
| Total | 33 (100.0%) | 0 (0.0%) |
Fertility by Education in Smithville
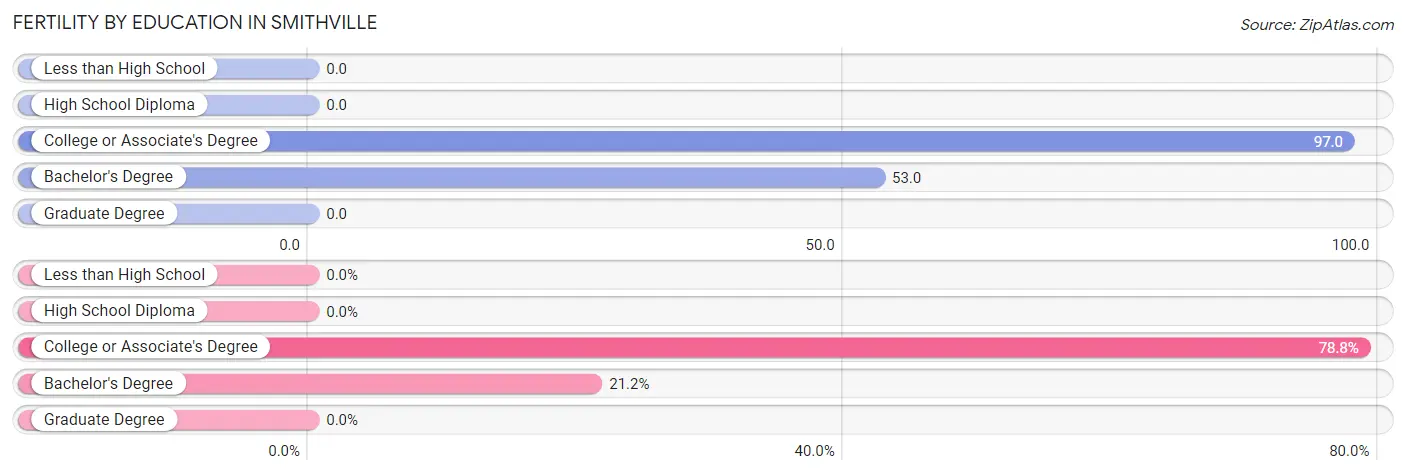
| Educational Attainment | Women with Births | Births / 1,000 Women |
| Less than High School | 0 (0.0%) | 0.0 |
| High School Diploma | 0 (0.0%) | 0.0 |
| College or Associate's Degree | 26 (78.8%) | 97.0 |
| Bachelor's Degree | 7 (21.2%) | 53.0 |
| Graduate Degree | 0 (0.0%) | 0.0 |
| Total | 33 (100.0%) | 36.0 |
Fertility by Education by Marriage Status in Smithville
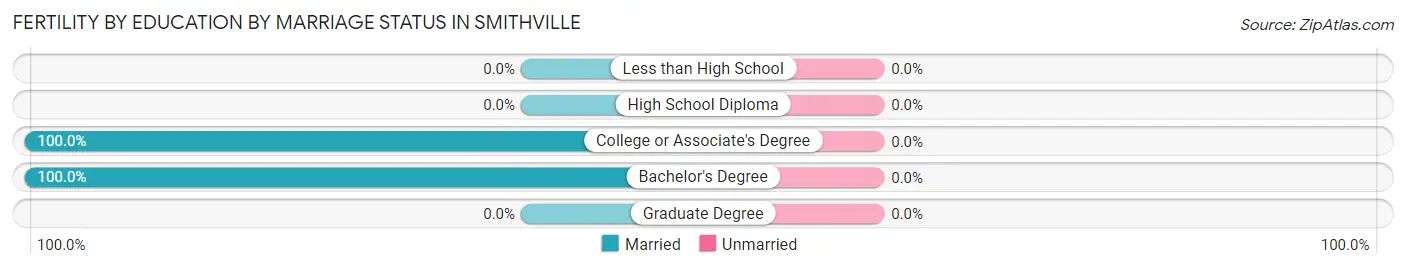
| Educational Attainment | Married | Unmarried |
| Less than High School | 0 (0.0%) | 0 (0.0%) |
| High School Diploma | 0 (0.0%) | 0 (0.0%) |
| College or Associate's Degree | 26 (100.0%) | 0 (0.0%) |
| Bachelor's Degree | 7 (100.0%) | 0 (0.0%) |
| Graduate Degree | 0 (0.0%) | 0 (0.0%) |
| Total | 33 (100.0%) | 0 (0.0%) |
Employment Characteristics in Smithville
Employment by Class of Employer in Smithville
Among the 2,118 employed individuals in Smithville, private company employees (1,326 | 62.6%), local government employees (261 | 12.3%), and self-employed (not incorporated) (200 | 9.4%) make up the most common classes of employment.
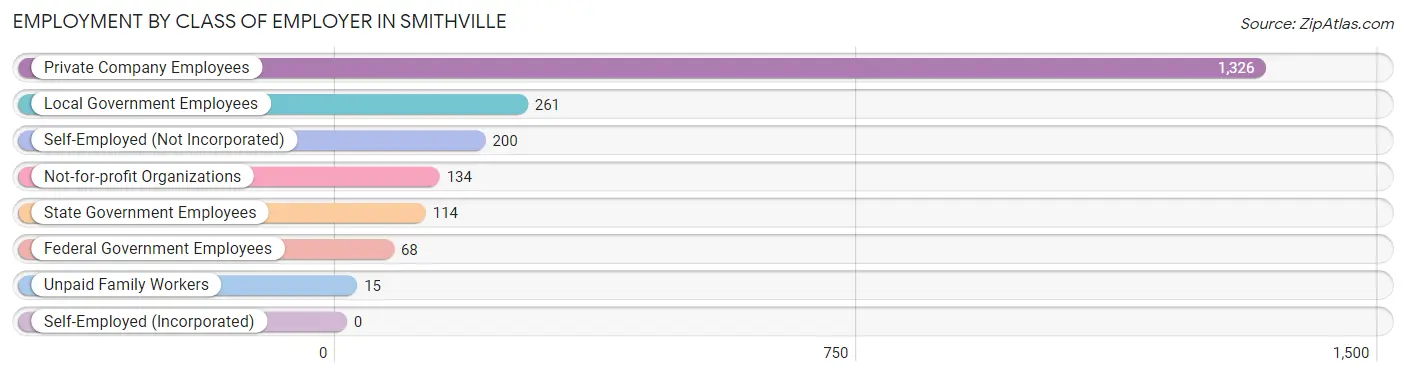
| Employer Class | # Employees | % Employees |
| Private Company Employees | 1,326 | 62.6% |
| Self-Employed (Incorporated) | 0 | 0.0% |
| Self-Employed (Not Incorporated) | 200 | 9.4% |
| Not-for-profit Organizations | 134 | 6.3% |
| Local Government Employees | 261 | 12.3% |
| State Government Employees | 114 | 5.4% |
| Federal Government Employees | 68 | 3.2% |
| Unpaid Family Workers | 15 | 0.7% |
| Total | 2,118 | 100.0% |
Employment Status by Age in Smithville
According to the labor force statistics for Smithville, out of the total population over 16 years of age (3,284), 69.6% or 2,286 individuals are in the labor force, with 4.5% or 103 of them unemployed. The age group with the highest labor force participation rate is 20 to 24 years, with 98.4% or 120 individuals in the labor force. Within the labor force, the 20 to 24 years age range has the highest percentage of unemployed individuals, with 30.8% or 37 of them being unemployed.
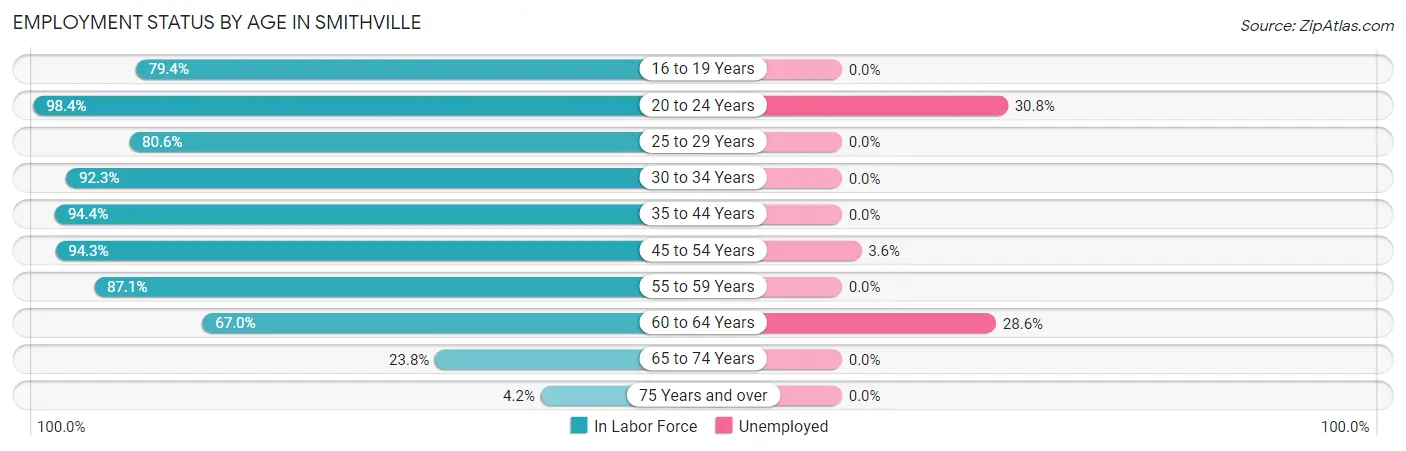
| Age Bracket | In Labor Force | Unemployed |
| 16 to 19 Years | 131 (79.4%) | 0 (0.0%) |
| 20 to 24 Years | 120 (98.4%) | 37 (30.8%) |
| 25 to 29 Years | 100 (80.6%) | 0 (0.0%) |
| 30 to 34 Years | 275 (92.3%) | 0 (0.0%) |
| 35 to 44 Years | 521 (94.4%) | 0 (0.0%) |
| 45 to 54 Years | 748 (94.3%) | 27 (3.6%) |
| 55 to 59 Years | 128 (87.1%) | 0 (0.0%) |
| 60 to 64 Years | 140 (67.0%) | 40 (28.6%) |
| 65 to 74 Years | 106 (23.8%) | 0 (0.0%) |
| 75 Years and over | 18 (4.2%) | 0 (0.0%) |
| Total | 2,286 (69.6%) | 103 (4.5%) |
Employment Status by Educational Attainment in Smithville
According to labor force statistics for Smithville, 90.1% of individuals (1,913) out of the total population between 25 and 64 years of age (2,123) are in the labor force, with 3.5% or 67 of them being unemployed. The group with the highest labor force participation rate are those with the educational attainment of less than high school, with 99.4% or 333 individuals in the labor force. Within the labor force, individuals with college / associate degree education have the highest percentage of unemployment, with 5.8% or 40 of them being unemployed.
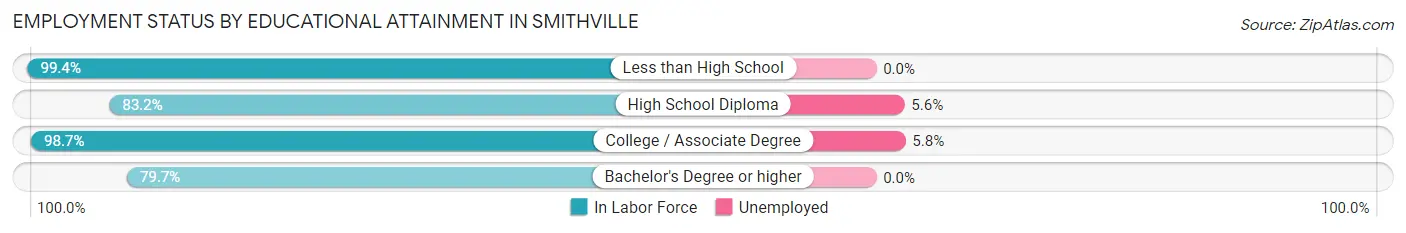
| Educational Attainment | In Labor Force | Unemployed |
| Less than High School | 333 (99.4%) | 0 (0.0%) |
| High School Diploma | 486 (83.2%) | 33 (5.6%) |
| College / Associate Degree | 692 (98.7%) | 41 (5.8%) |
| Bachelor's Degree or higher | 401 (79.7%) | 0 (0.0%) |
| Total | 1,913 (90.1%) | 74 (3.5%) |
Employment Occupations by Sex in Smithville
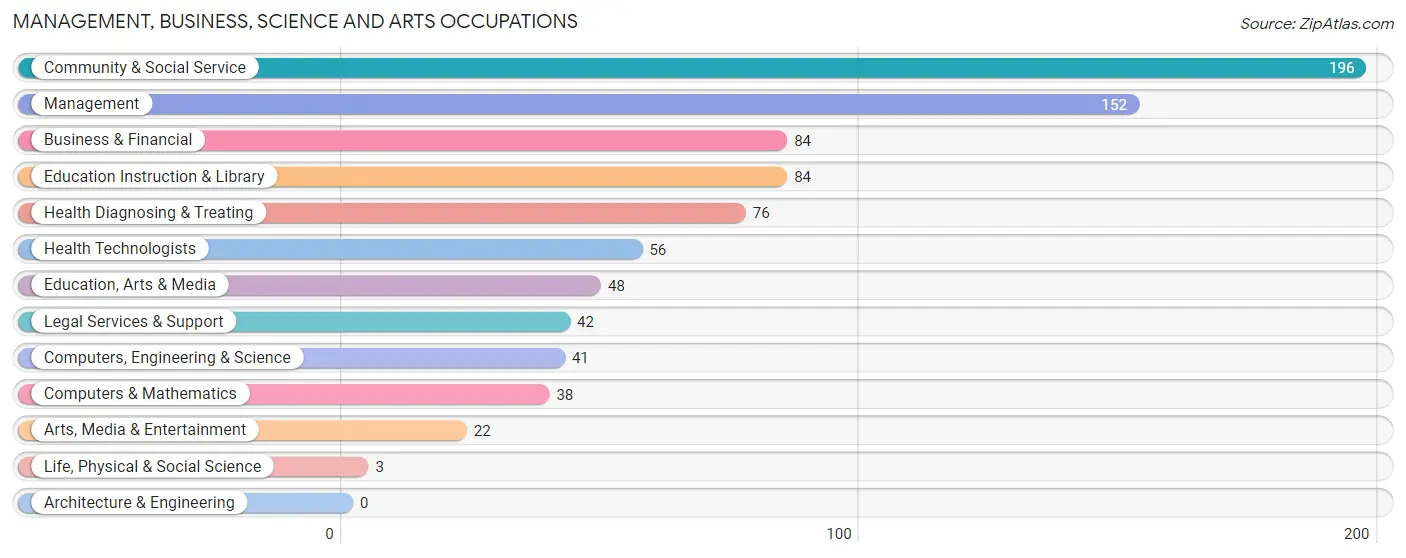
Management, Business, Science and Arts Occupations
The most common Management, Business, Science and Arts occupations in Smithville are Community & Social Service (196 | 9.0%), Management (152 | 7.0%), Business & Financial (84 | 3.8%), Education Instruction & Library (84 | 3.8%), and Health Diagnosing & Treating (76 | 3.5%).
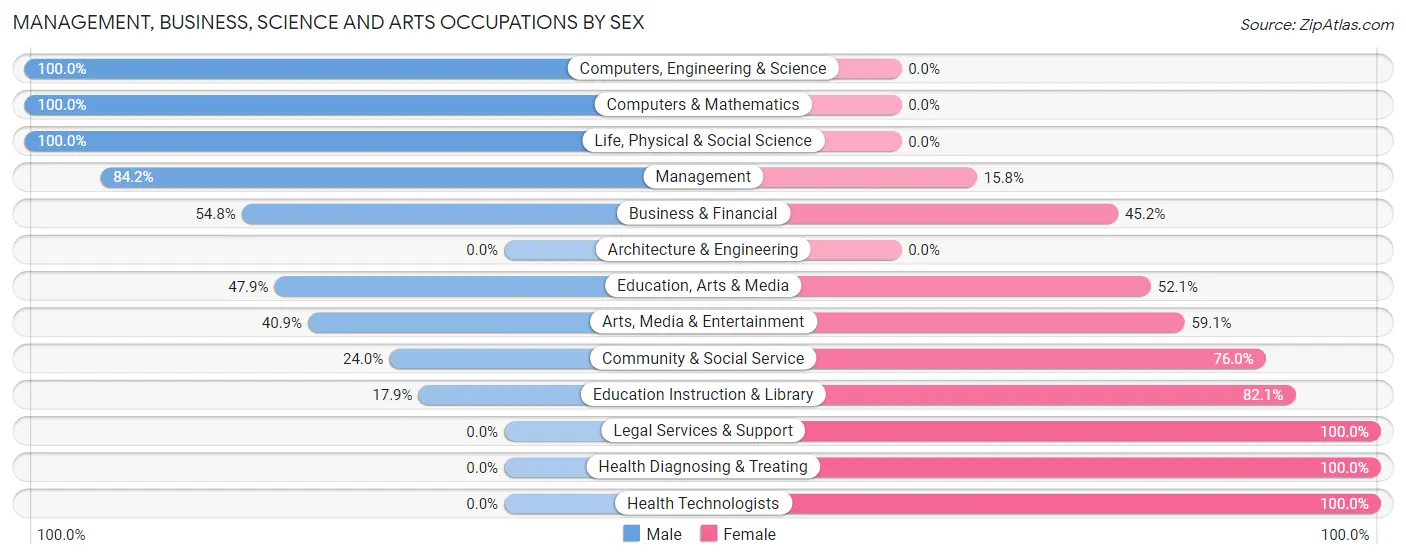
Management, Business, Science and Arts Occupations by Sex
Within the Management, Business, Science and Arts occupations in Smithville, the most male-oriented occupations are Computers, Engineering & Science (100.0%), Computers & Mathematics (100.0%), and Life, Physical & Social Science (100.0%), while the most female-oriented occupations are Legal Services & Support (100.0%), Health Diagnosing & Treating (100.0%), and Health Technologists (100.0%).
| Occupation | Male | Female |
| Management | 128 (84.2%) | 24 (15.8%) |
| Business & Financial | 46 (54.8%) | 38 (45.2%) |
| Computers, Engineering & Science | 41 (100.0%) | 0 (0.0%) |
| Computers & Mathematics | 38 (100.0%) | 0 (0.0%) |
| Architecture & Engineering | 0 (0.0%) | 0 (0.0%) |
| Life, Physical & Social Science | 3 (100.0%) | 0 (0.0%) |
| Community & Social Service | 47 (24.0%) | 149 (76.0%) |
| Education, Arts & Media | 23 (47.9%) | 25 (52.1%) |
| Legal Services & Support | 0 (0.0%) | 42 (100.0%) |
| Education Instruction & Library | 15 (17.9%) | 69 (82.1%) |
| Arts, Media & Entertainment | 9 (40.9%) | 13 (59.1%) |
| Health Diagnosing & Treating | 0 (0.0%) | 76 (100.0%) |
| Health Technologists | 0 (0.0%) | 56 (100.0%) |
| Total (Category) | 262 (47.7%) | 287 (52.3%) |
| Total (Overall) | 1,252 (57.4%) | 931 (42.6%) |
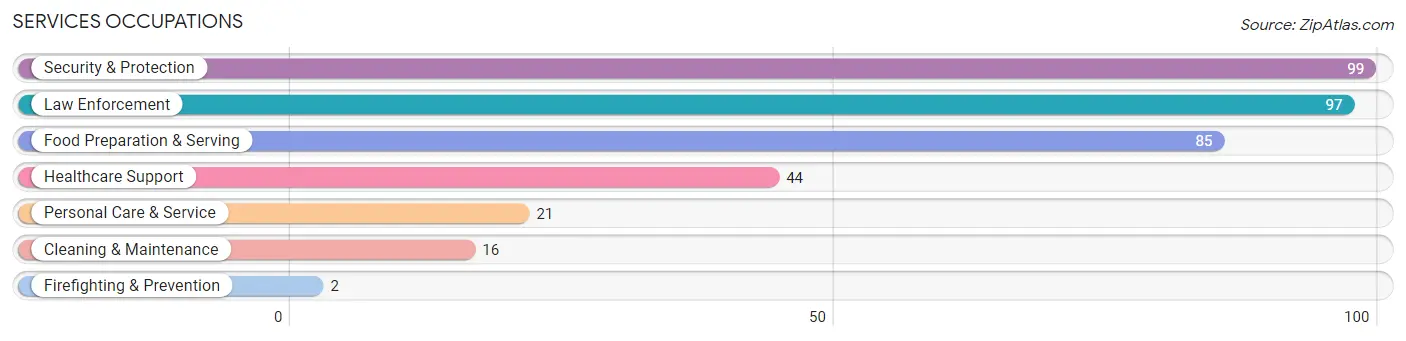
Services Occupations
The most common Services occupations in Smithville are Security & Protection (99 | 4.5%), Law Enforcement (97 | 4.4%), Food Preparation & Serving (85 | 3.9%), Healthcare Support (44 | 2.0%), and Personal Care & Service (21 | 1.0%).
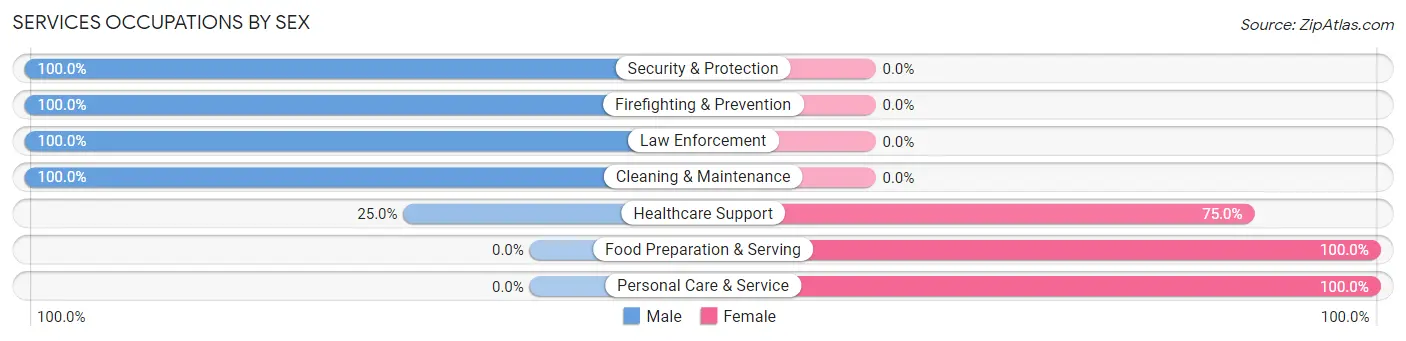
Services Occupations by Sex
Within the Services occupations in Smithville, the most male-oriented occupations are Security & Protection (100.0%), Firefighting & Prevention (100.0%), and Law Enforcement (100.0%), while the most female-oriented occupations are Food Preparation & Serving (100.0%), Personal Care & Service (100.0%), and Healthcare Support (75.0%).
| Occupation | Male | Female |
| Healthcare Support | 11 (25.0%) | 33 (75.0%) |
| Security & Protection | 99 (100.0%) | 0 (0.0%) |
| Firefighting & Prevention | 2 (100.0%) | 0 (0.0%) |
| Law Enforcement | 97 (100.0%) | 0 (0.0%) |
| Food Preparation & Serving | 0 (0.0%) | 85 (100.0%) |
| Cleaning & Maintenance | 16 (100.0%) | 0 (0.0%) |
| Personal Care & Service | 0 (0.0%) | 21 (100.0%) |
| Total (Category) | 126 (47.5%) | 139 (52.4%) |
| Total (Overall) | 1,252 (57.4%) | 931 (42.6%) |
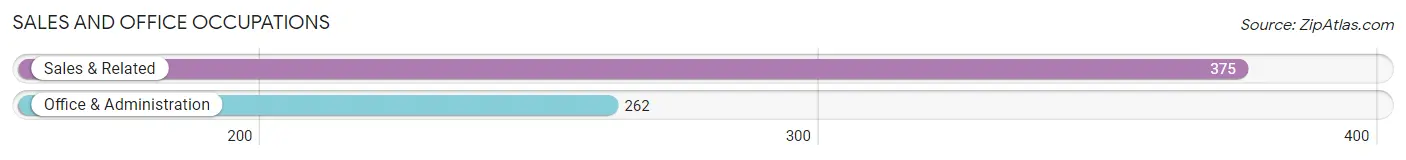
Sales and Office Occupations
The most common Sales and Office occupations in Smithville are Sales & Related (375 | 17.2%), and Office & Administration (262 | 12.0%).
Sales and Office Occupations by Sex
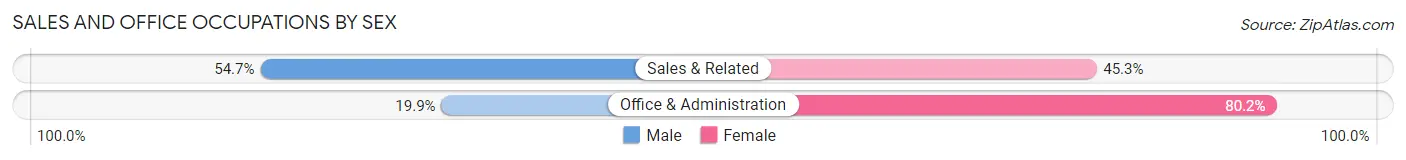
| Occupation | Male | Female |
| Sales & Related | 205 (54.7%) | 170 (45.3%) |
| Office & Administration | 52 (19.9%) | 210 (80.1%) |
| Total (Category) | 257 (40.4%) | 380 (59.7%) |
| Total (Overall) | 1,252 (57.4%) | 931 (42.6%) |
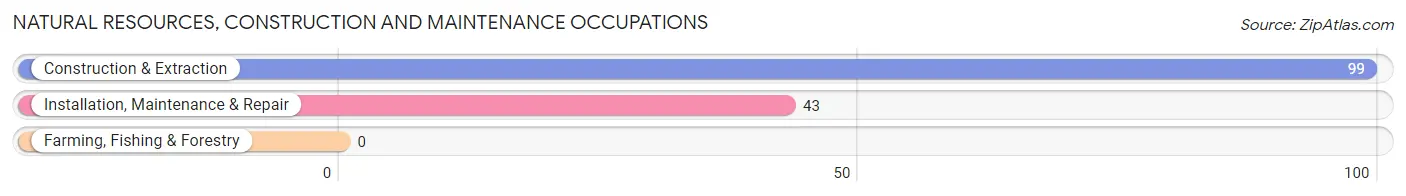
Natural Resources, Construction and Maintenance Occupations
The most common Natural Resources, Construction and Maintenance occupations in Smithville are Construction & Extraction (99 | 4.5%), and Installation, Maintenance & Repair (43 | 2.0%).
Natural Resources, Construction and Maintenance Occupations by Sex
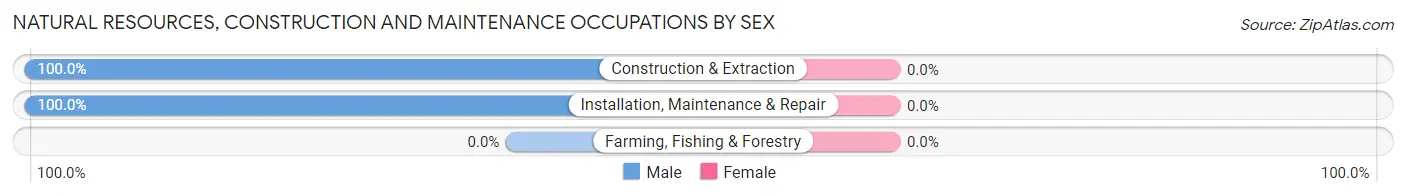
| Occupation | Male | Female |
| Farming, Fishing & Forestry | 0 (0.0%) | 0 (0.0%) |
| Construction & Extraction | 99 (100.0%) | 0 (0.0%) |
| Installation, Maintenance & Repair | 43 (100.0%) | 0 (0.0%) |
| Total (Category) | 142 (100.0%) | 0 (0.0%) |
| Total (Overall) | 1,252 (57.4%) | 931 (42.6%) |
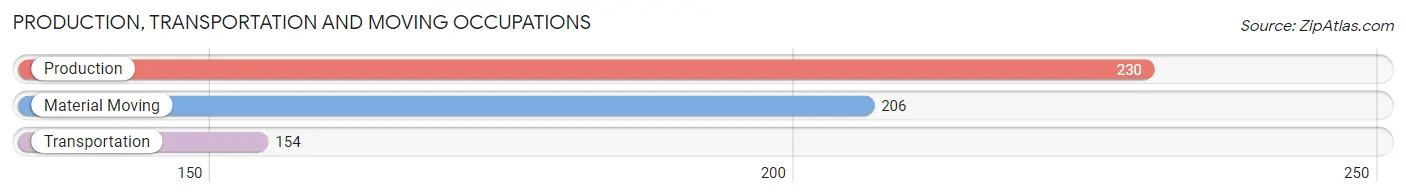
Production, Transportation and Moving Occupations
The most common Production, Transportation and Moving occupations in Smithville are Production (230 | 10.5%), Material Moving (206 | 9.4%), and Transportation (154 | 7.0%).
Production, Transportation and Moving Occupations by Sex
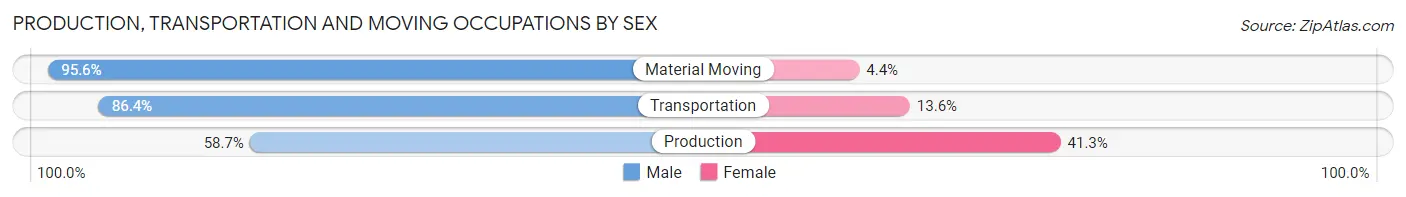
| Occupation | Male | Female |
| Production | 135 (58.7%) | 95 (41.3%) |
| Transportation | 133 (86.4%) | 21 (13.6%) |
| Material Moving | 197 (95.6%) | 9 (4.4%) |
| Total (Category) | 465 (78.8%) | 125 (21.2%) |
| Total (Overall) | 1,252 (57.4%) | 931 (42.6%) |
Employment Industries by Sex in Smithville
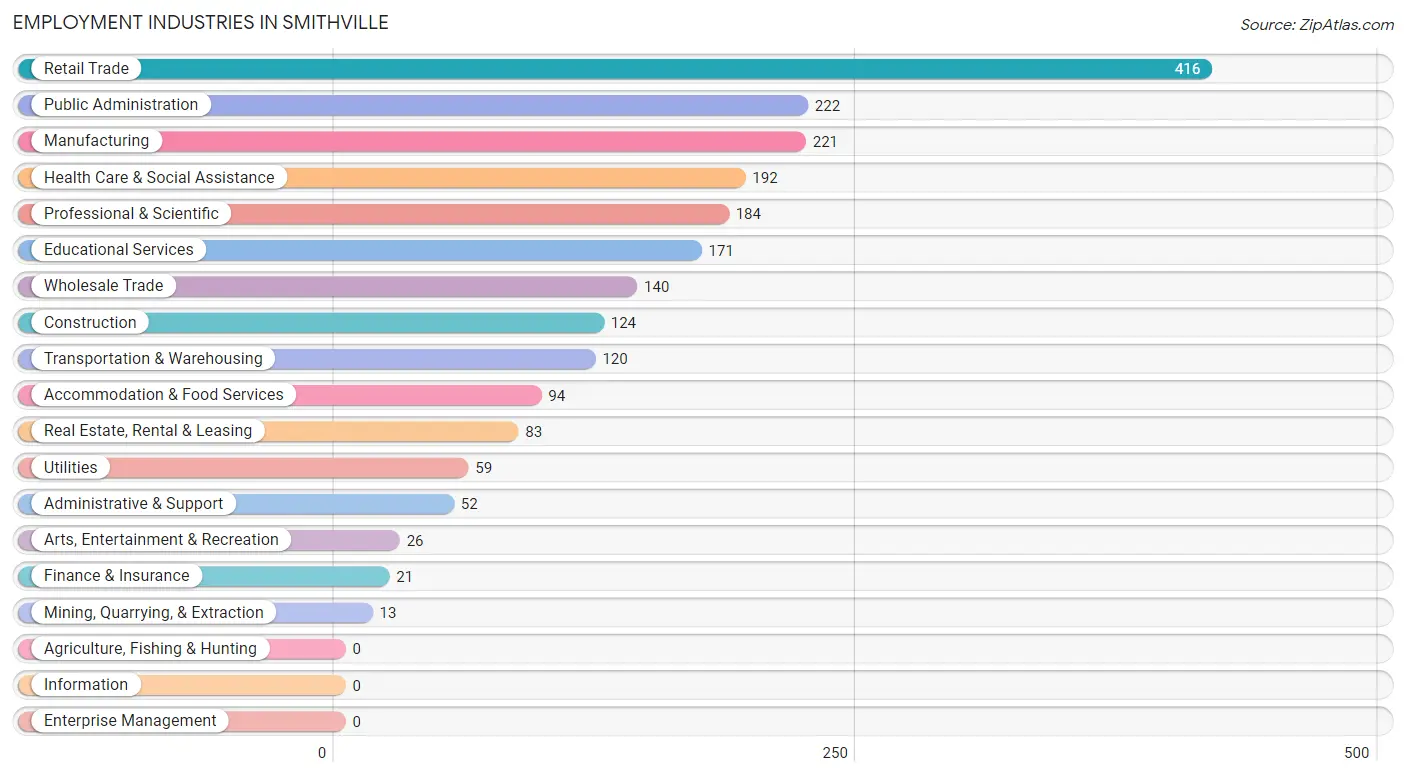
Employment Industries in Smithville
The major employment industries in Smithville include Retail Trade (416 | 19.1%), Public Administration (222 | 10.2%), Manufacturing (221 | 10.1%), Health Care & Social Assistance (192 | 8.8%), and Professional & Scientific (184 | 8.4%).
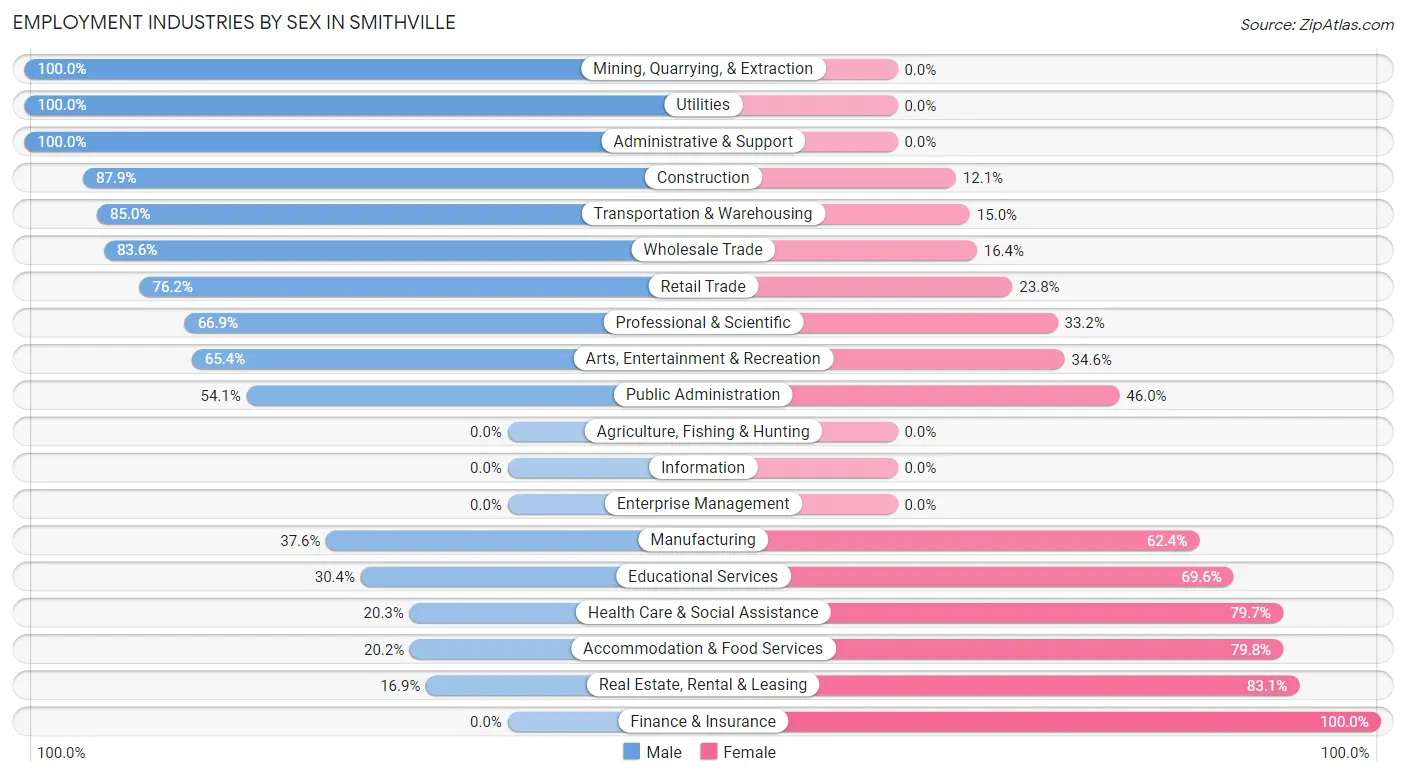
Employment Industries by Sex in Smithville
The Smithville industries that see more men than women are Mining, Quarrying, & Extraction (100.0%), Utilities (100.0%), and Administrative & Support (100.0%), whereas the industries that tend to have a higher number of women are Finance & Insurance (100.0%), Real Estate, Rental & Leasing (83.1%), and Accommodation & Food Services (79.8%).
| Industry | Male | Female |
| Agriculture, Fishing & Hunting | 0 (0.0%) | 0 (0.0%) |
| Mining, Quarrying, & Extraction | 13 (100.0%) | 0 (0.0%) |
| Construction | 109 (87.9%) | 15 (12.1%) |
| Manufacturing | 83 (37.6%) | 138 (62.4%) |
| Wholesale Trade | 117 (83.6%) | 23 (16.4%) |
| Retail Trade | 317 (76.2%) | 99 (23.8%) |
| Transportation & Warehousing | 102 (85.0%) | 18 (15.0%) |
| Utilities | 59 (100.0%) | 0 (0.0%) |
| Information | 0 (0.0%) | 0 (0.0%) |
| Finance & Insurance | 0 (0.0%) | 21 (100.0%) |
| Real Estate, Rental & Leasing | 14 (16.9%) | 69 (83.1%) |
| Professional & Scientific | 123 (66.8%) | 61 (33.2%) |
| Enterprise Management | 0 (0.0%) | 0 (0.0%) |
| Administrative & Support | 52 (100.0%) | 0 (0.0%) |
| Educational Services | 52 (30.4%) | 119 (69.6%) |
| Health Care & Social Assistance | 39 (20.3%) | 153 (79.7%) |
| Arts, Entertainment & Recreation | 17 (65.4%) | 9 (34.6%) |
| Accommodation & Food Services | 19 (20.2%) | 75 (79.8%) |
| Public Administration | 120 (54.0%) | 102 (46.0%) |
| Total | 1,252 (57.4%) | 931 (42.6%) |
Education in Smithville
School Enrollment in Smithville
The most common levels of schooling among the 791 students in Smithville are high school (180 | 22.8%), elementary school (176 | 22.3%), and college / undergraduate (144 | 18.2%).
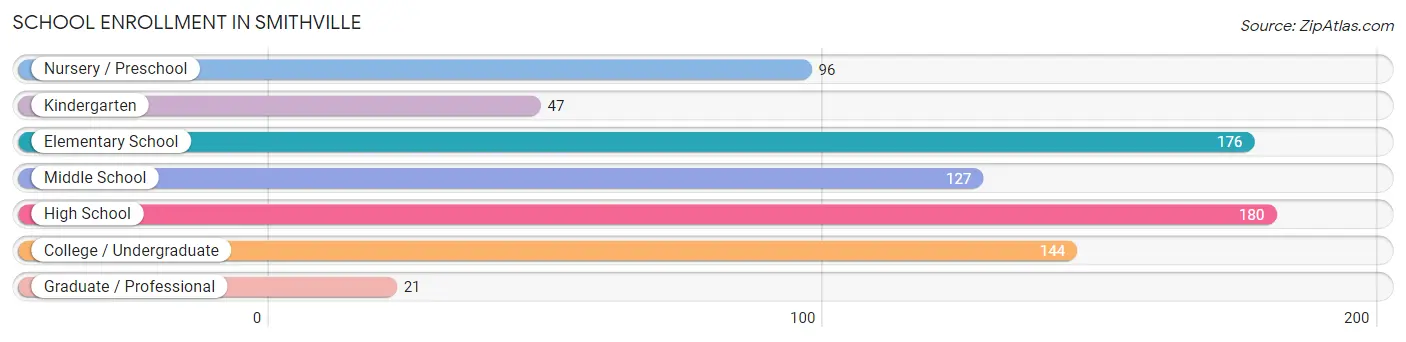
| School Level | # Students | % Students |
| Nursery / Preschool | 96 | 12.1% |
| Kindergarten | 47 | 5.9% |
| Elementary School | 176 | 22.3% |
| Middle School | 127 | 16.1% |
| High School | 180 | 22.8% |
| College / Undergraduate | 144 | 18.2% |
| Graduate / Professional | 21 | 2.6% |
| Total | 791 | 100.0% |
School Enrollment by Age by Funding Source in Smithville
Out of a total of 791 students who are enrolled in schools in Smithville, 144 (18.2%) attend a private institution, while the remaining 647 (81.8%) are enrolled in public schools. The age group of 20 to 24 year olds has the highest likelihood of being enrolled in private schools, with 37 (63.8% in the age bracket) enrolled. Conversely, the age group of 15 to 17 year olds has the lowest likelihood of being enrolled in a private school, with 145 (100.0% in the age bracket) attending a public institution.
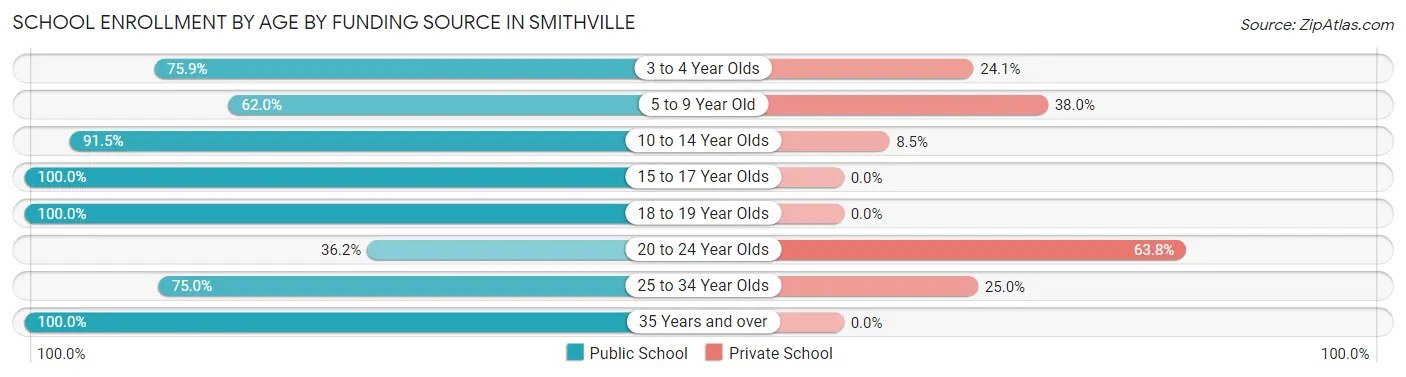
| Age Bracket | Public School | Private School |
| 3 to 4 Year Olds | 66 (75.9%) | 21 (24.1%) |
| 5 to 9 Year Old | 106 (62.0%) | 65 (38.0%) |
| 10 to 14 Year Olds | 194 (91.5%) | 18 (8.5%) |
| 15 to 17 Year Olds | 145 (100.0%) | 0 (0.0%) |
| 18 to 19 Year Olds | 68 (100.0%) | 0 (0.0%) |
| 20 to 24 Year Olds | 21 (36.2%) | 37 (63.8%) |
| 25 to 34 Year Olds | 9 (75.0%) | 3 (25.0%) |
| 35 Years and over | 38 (100.0%) | 0 (0.0%) |
| Total | 647 (81.8%) | 144 (18.2%) |
Educational Attainment by Field of Study in Smithville
Education (124 | 17.1%), science & technology (92 | 12.7%), business (91 | 12.5%), bio, nature & agricultural (86 | 11.8%), and arts & humanities (71 | 9.8%) are the most common fields of study among 727 individuals in Smithville who have obtained a bachelor's degree or higher.
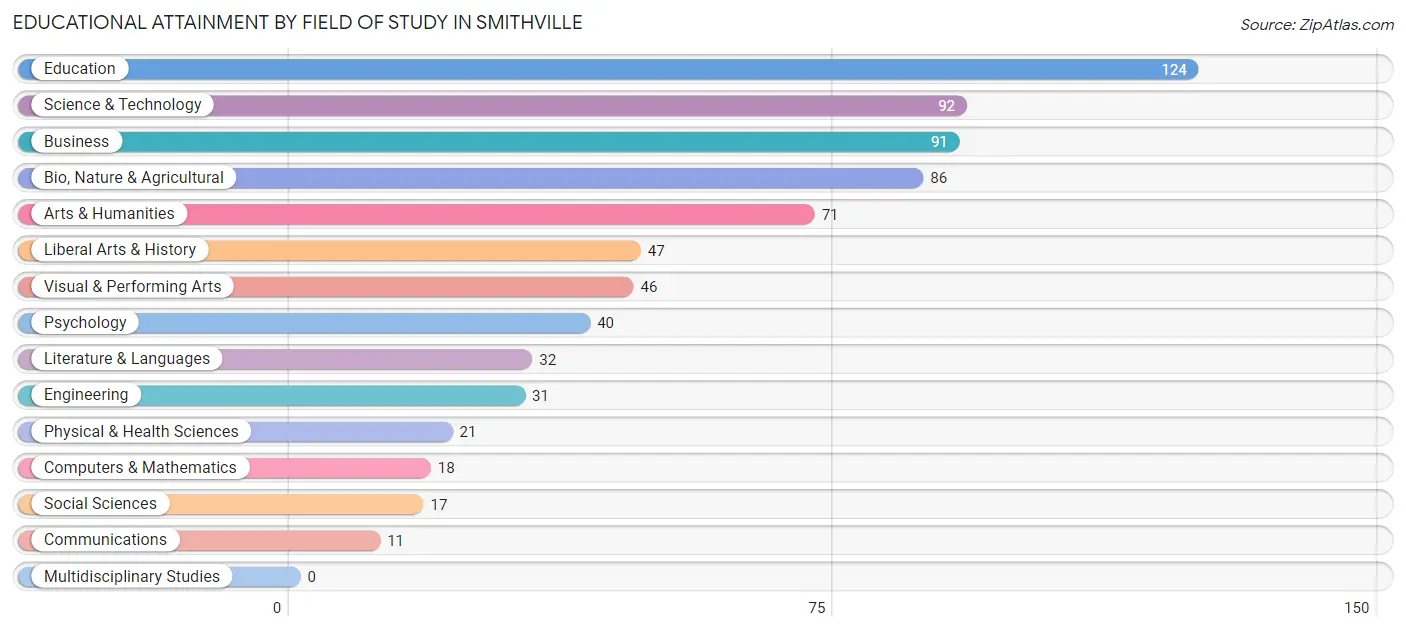
| Field of Study | # Graduates | % Graduates |
| Computers & Mathematics | 18 | 2.5% |
| Bio, Nature & Agricultural | 86 | 11.8% |
| Physical & Health Sciences | 21 | 2.9% |
| Psychology | 40 | 5.5% |
| Social Sciences | 17 | 2.3% |
| Engineering | 31 | 4.3% |
| Multidisciplinary Studies | 0 | 0.0% |
| Science & Technology | 92 | 12.7% |
| Business | 91 | 12.5% |
| Education | 124 | 17.1% |
| Literature & Languages | 32 | 4.4% |
| Liberal Arts & History | 47 | 6.5% |
| Visual & Performing Arts | 46 | 6.3% |
| Communications | 11 | 1.5% |
| Arts & Humanities | 71 | 9.8% |
| Total | 727 | 100.0% |
Transportation & Commute in Smithville
Vehicle Availability by Sex in Smithville
The most prevalent vehicle ownership categories in Smithville are males with 2 vehicles (498, accounting for 39.9%) and females with 2 vehicles (432, making up 57.5%).
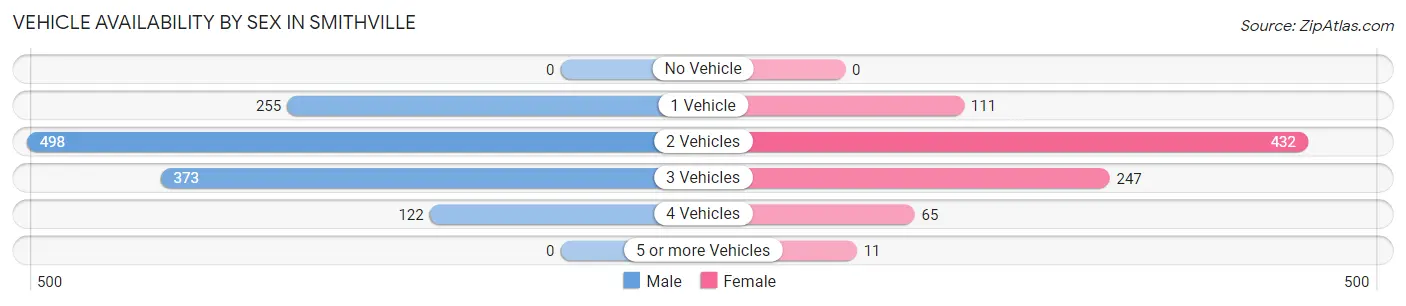
| Vehicles Available | Male | Female |
| No Vehicle | 0 (0.0%) | 0 (0.0%) |
| 1 Vehicle | 255 (20.4%) | 111 (12.8%) |
| 2 Vehicles | 498 (39.9%) | 432 (49.9%) |
| 3 Vehicles | 373 (29.9%) | 247 (28.5%) |
| 4 Vehicles | 122 (9.8%) | 65 (7.5%) |
| 5 or more Vehicles | 0 (0.0%) | 11 (1.3%) |
| Total | 1,248 (100.0%) | 866 (100.0%) |
Commute Time in Smithville
The most frequently occuring commute durations in Smithville are 60 to 89 minutes (337 commuters, 16.9%), 20 to 24 minutes (306 commuters, 15.4%), and 5 to 9 minutes (278 commuters, 14.0%).
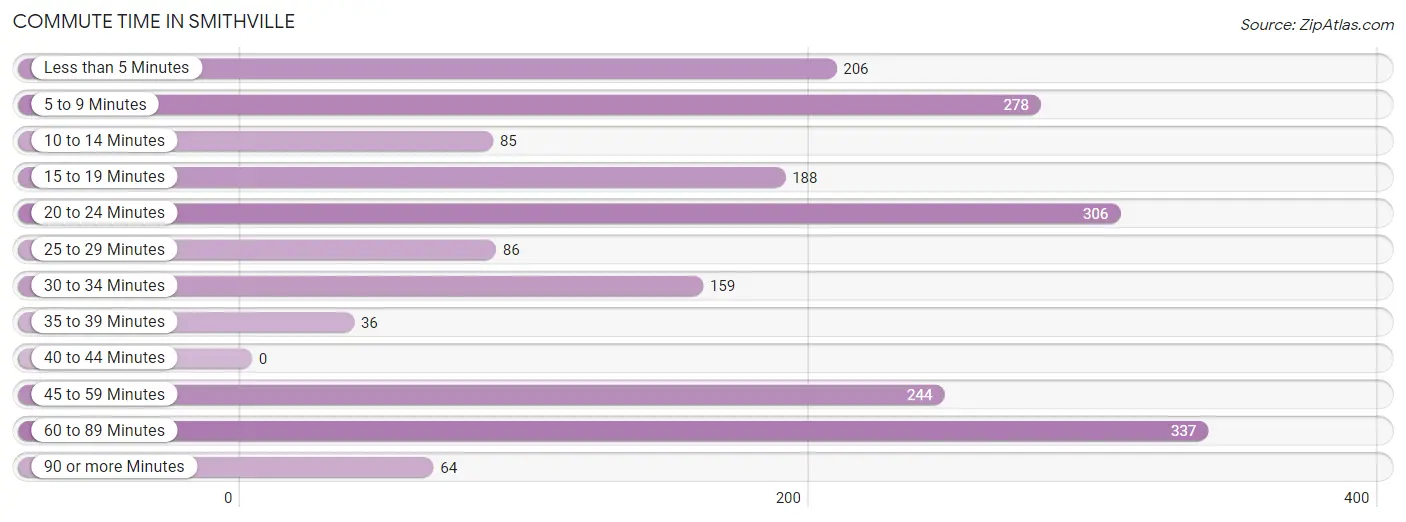
| Commute Time | # Commuters | % Commuters |
| Less than 5 Minutes | 206 | 10.4% |
| 5 to 9 Minutes | 278 | 14.0% |
| 10 to 14 Minutes | 85 | 4.3% |
| 15 to 19 Minutes | 188 | 9.5% |
| 20 to 24 Minutes | 306 | 15.4% |
| 25 to 29 Minutes | 86 | 4.3% |
| 30 to 34 Minutes | 159 | 8.0% |
| 35 to 39 Minutes | 36 | 1.8% |
| 40 to 44 Minutes | 0 | 0.0% |
| 45 to 59 Minutes | 244 | 12.3% |
| 60 to 89 Minutes | 337 | 16.9% |
| 90 or more Minutes | 64 | 3.2% |
Commute Time by Sex in Smithville
The most common commute times in Smithville are 60 to 89 minutes (282 commuters, 23.9%) for males and 20 to 24 minutes (274 commuters, 33.8%) for females.
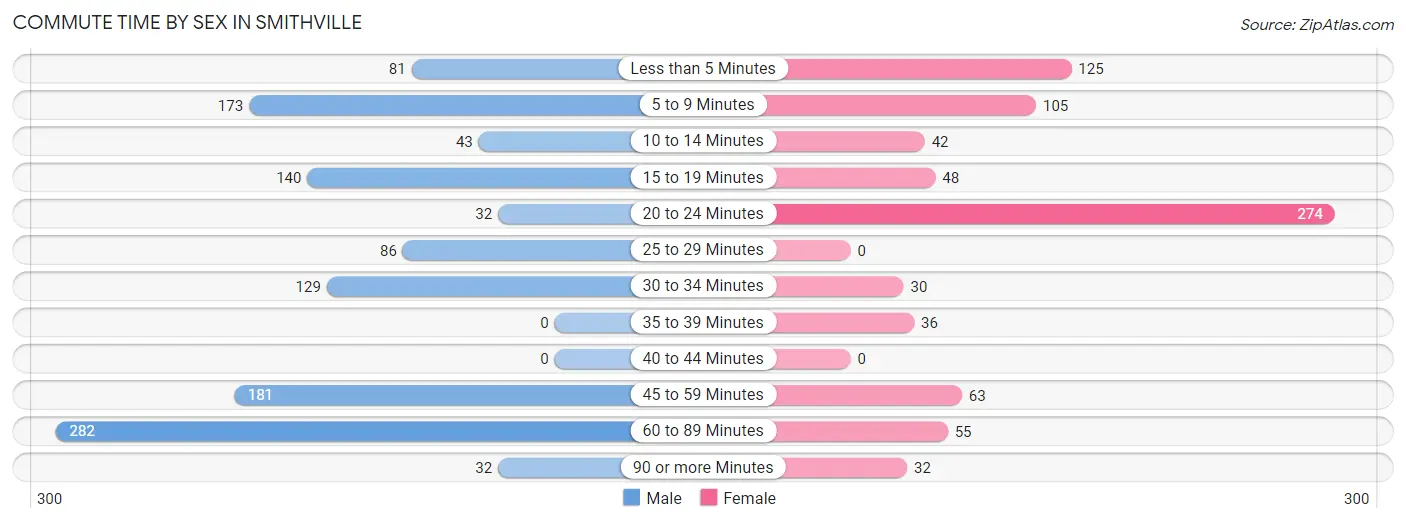
| Commute Time | Male | Female |
| Less than 5 Minutes | 81 (6.9%) | 125 (15.4%) |
| 5 to 9 Minutes | 173 (14.7%) | 105 (13.0%) |
| 10 to 14 Minutes | 43 (3.6%) | 42 (5.2%) |
| 15 to 19 Minutes | 140 (11.9%) | 48 (5.9%) |
| 20 to 24 Minutes | 32 (2.7%) | 274 (33.8%) |
| 25 to 29 Minutes | 86 (7.3%) | 0 (0.0%) |
| 30 to 34 Minutes | 129 (10.9%) | 30 (3.7%) |
| 35 to 39 Minutes | 0 (0.0%) | 36 (4.4%) |
| 40 to 44 Minutes | 0 (0.0%) | 0 (0.0%) |
| 45 to 59 Minutes | 181 (15.3%) | 63 (7.8%) |
| 60 to 89 Minutes | 282 (23.9%) | 55 (6.8%) |
| 90 or more Minutes | 32 (2.7%) | 32 (4.0%) |
Time of Departure to Work by Sex in Smithville
The most frequent times of departure to work in Smithville are 6:30 AM to 6:59 AM (304, 25.8%) for males and 7:00 AM to 7:29 AM (207, 25.6%) for females.
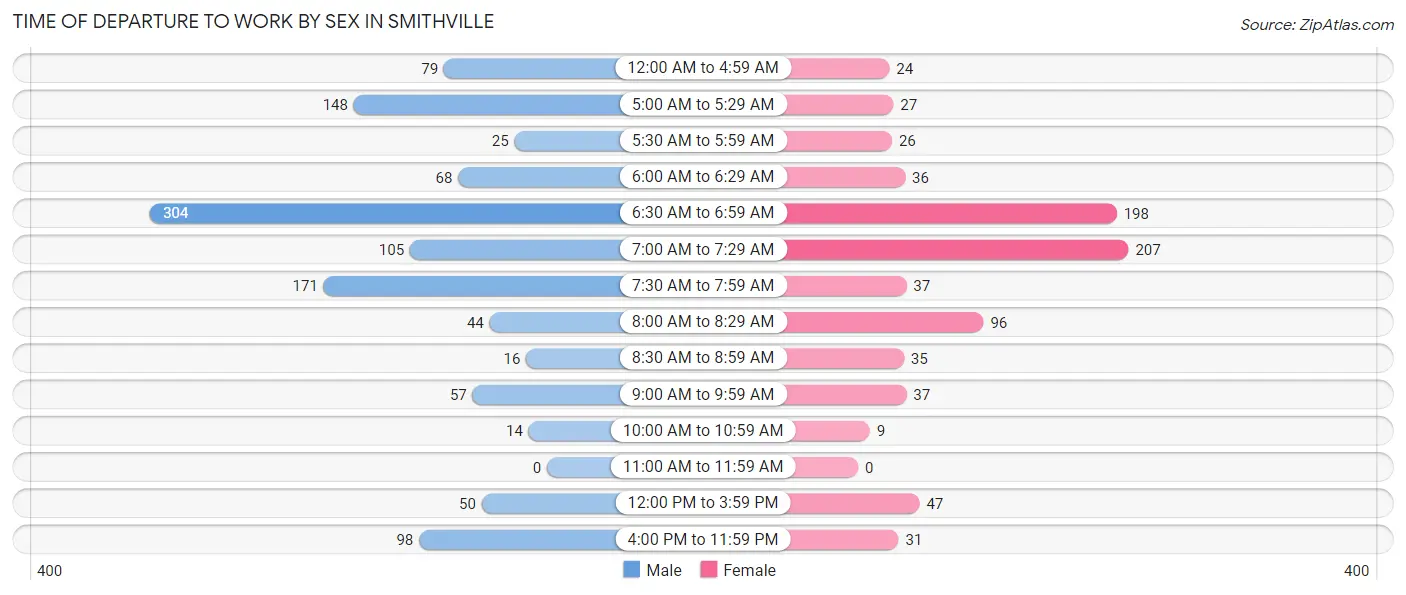
| Time of Departure | Male | Female |
| 12:00 AM to 4:59 AM | 79 (6.7%) | 24 (3.0%) |
| 5:00 AM to 5:29 AM | 148 (12.6%) | 27 (3.3%) |
| 5:30 AM to 5:59 AM | 25 (2.1%) | 26 (3.2%) |
| 6:00 AM to 6:29 AM | 68 (5.8%) | 36 (4.4%) |
| 6:30 AM to 6:59 AM | 304 (25.8%) | 198 (24.4%) |
| 7:00 AM to 7:29 AM | 105 (8.9%) | 207 (25.6%) |
| 7:30 AM to 7:59 AM | 171 (14.5%) | 37 (4.6%) |
| 8:00 AM to 8:29 AM | 44 (3.7%) | 96 (11.8%) |
| 8:30 AM to 8:59 AM | 16 (1.4%) | 35 (4.3%) |
| 9:00 AM to 9:59 AM | 57 (4.8%) | 37 (4.6%) |
| 10:00 AM to 10:59 AM | 14 (1.2%) | 9 (1.1%) |
| 11:00 AM to 11:59 AM | 0 (0.0%) | 0 (0.0%) |
| 12:00 PM to 3:59 PM | 50 (4.2%) | 47 (5.8%) |
| 4:00 PM to 11:59 PM | 98 (8.3%) | 31 (3.8%) |
| Total | 1,179 (100.0%) | 810 (100.0%) |
Housing Occupancy in Smithville
Occupancy by Ownership in Smithville
Of the total 1,666 dwellings in Smithville, owner-occupied units account for 1,136 (68.2%), while renter-occupied units make up 530 (31.8%).
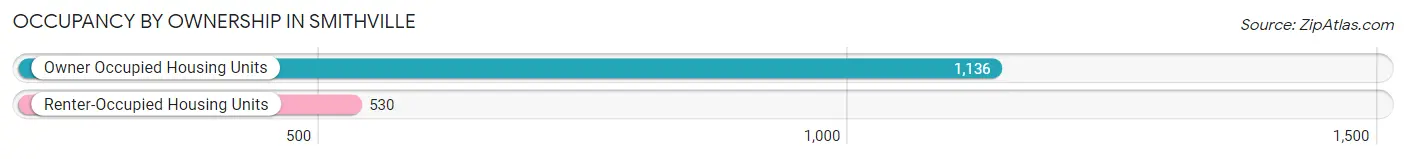
| Occupancy | # Housing Units | % Housing Units |
| Owner Occupied Housing Units | 1,136 | 68.2% |
| Renter-Occupied Housing Units | 530 | 31.8% |
| Total Occupied Housing Units | 1,666 | 100.0% |
Occupancy by Household Size in Smithville
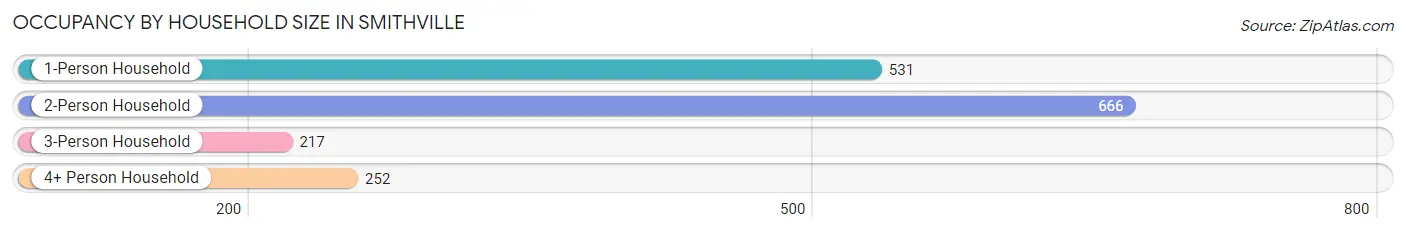
| Household Size | # Housing Units | % Housing Units |
| 1-Person Household | 531 | 31.9% |
| 2-Person Household | 666 | 40.0% |
| 3-Person Household | 217 | 13.0% |
| 4+ Person Household | 252 | 15.1% |
| Total Housing Units | 1,666 | 100.0% |
Occupancy by Ownership by Household Size in Smithville
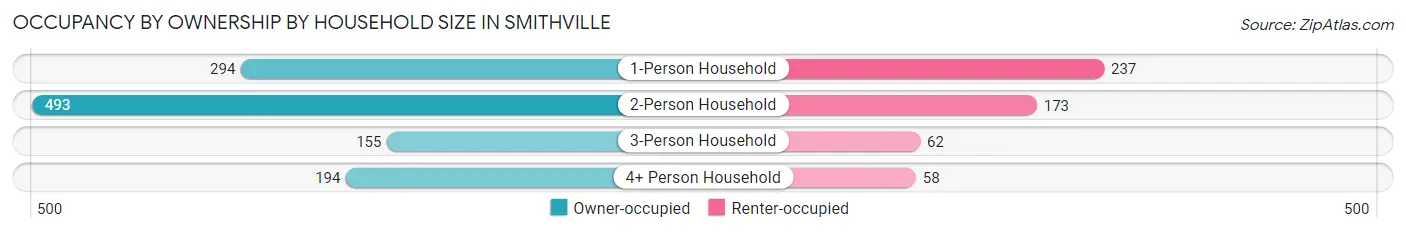
| Household Size | Owner-occupied | Renter-occupied |
| 1-Person Household | 294 (55.4%) | 237 (44.6%) |
| 2-Person Household | 493 (74.0%) | 173 (26.0%) |
| 3-Person Household | 155 (71.4%) | 62 (28.6%) |
| 4+ Person Household | 194 (77.0%) | 58 (23.0%) |
| Total Housing Units | 1,136 (68.2%) | 530 (31.8%) |
Occupancy by Educational Attainment in Smithville
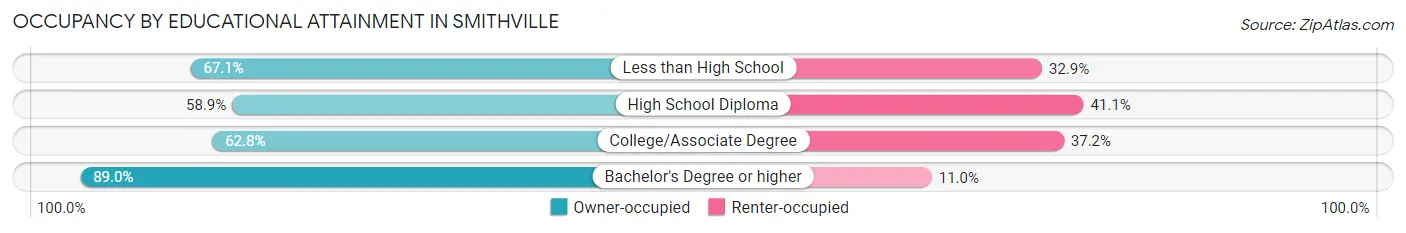
| Household Size | Owner-occupied | Renter-occupied |
| Less than High School | 100 (67.1%) | 49 (32.9%) |
| High School Diploma | 279 (58.9%) | 195 (41.1%) |
| College/Associate Degree | 410 (62.8%) | 243 (37.2%) |
| Bachelor's Degree or higher | 347 (89.0%) | 43 (11.0%) |
Occupancy by Age of Householder in Smithville
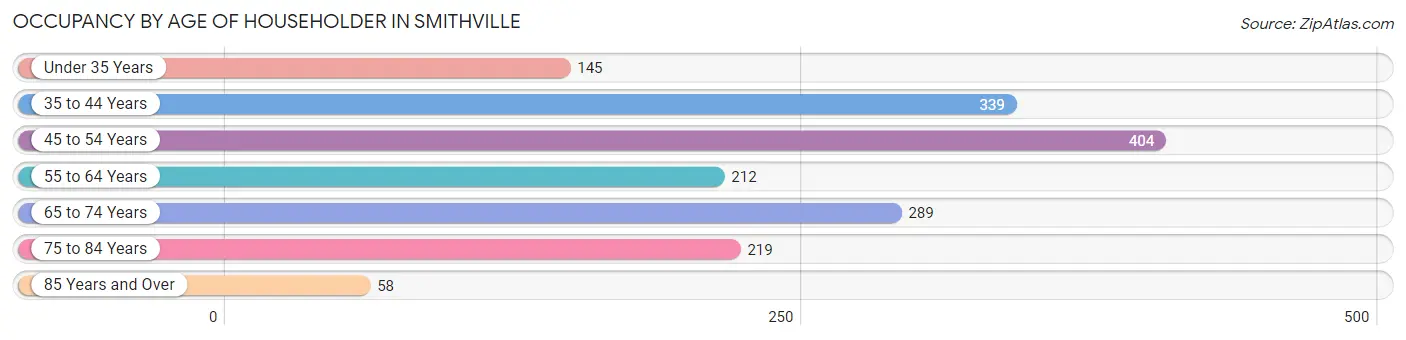
| Age Bracket | # Households | % Households |
| Under 35 Years | 145 | 8.7% |
| 35 to 44 Years | 339 | 20.3% |
| 45 to 54 Years | 404 | 24.2% |
| 55 to 64 Years | 212 | 12.7% |
| 65 to 74 Years | 289 | 17.3% |
| 75 to 84 Years | 219 | 13.2% |
| 85 Years and Over | 58 | 3.5% |
| Total | 1,666 | 100.0% |
Housing Finances in Smithville
Median Income by Occupancy in Smithville
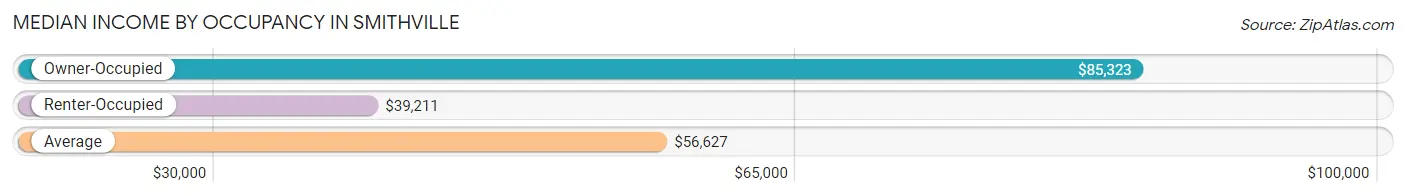
| Occupancy Type | # Households | Median Income |
| Owner-Occupied | 1,136 (68.2%) | $85,323 |
| Renter-Occupied | 530 (31.8%) | $39,211 |
| Average | 1,666 (100.0%) | $56,627 |
Occupancy by Householder Income Bracket in Smithville
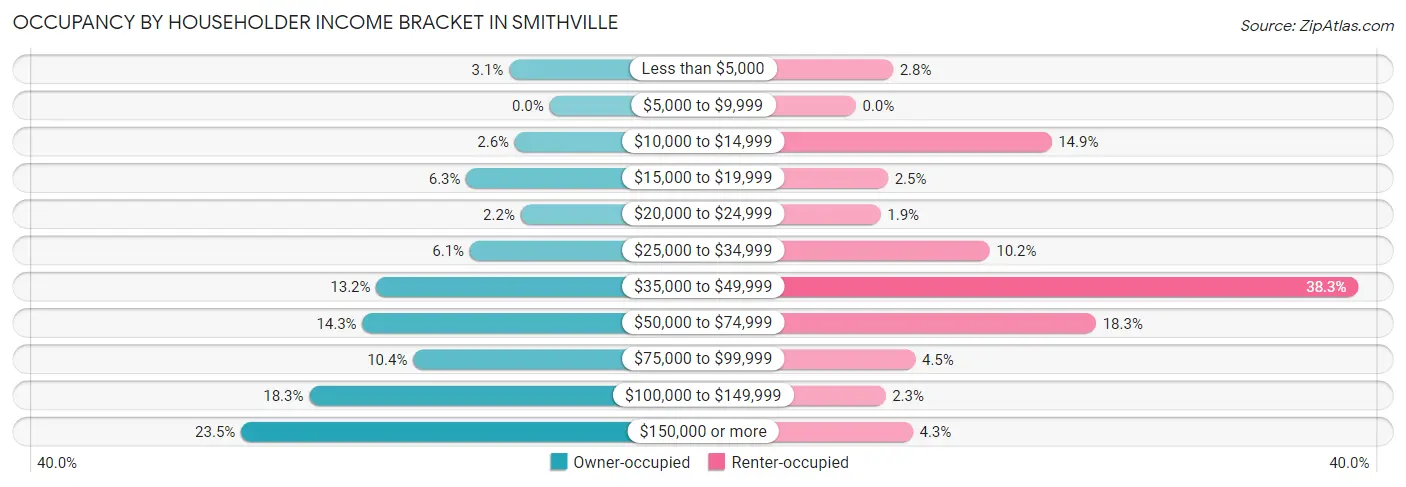
| Income Bracket | Owner-occupied | Renter-occupied |
| Less than $5,000 | 35 (3.1%) | 15 (2.8%) |
| $5,000 to $9,999 | 0 (0.0%) | 0 (0.0%) |
| $10,000 to $14,999 | 30 (2.6%) | 79 (14.9%) |
| $15,000 to $19,999 | 72 (6.3%) | 13 (2.5%) |
| $20,000 to $24,999 | 25 (2.2%) | 10 (1.9%) |
| $25,000 to $34,999 | 69 (6.1%) | 54 (10.2%) |
| $35,000 to $49,999 | 150 (13.2%) | 203 (38.3%) |
| $50,000 to $74,999 | 162 (14.3%) | 97 (18.3%) |
| $75,000 to $99,999 | 118 (10.4%) | 24 (4.5%) |
| $100,000 to $149,999 | 208 (18.3%) | 12 (2.3%) |
| $150,000 or more | 267 (23.5%) | 23 (4.3%) |
| Total | 1,136 (100.0%) | 530 (100.0%) |
Monthly Housing Cost Tiers in Smithville
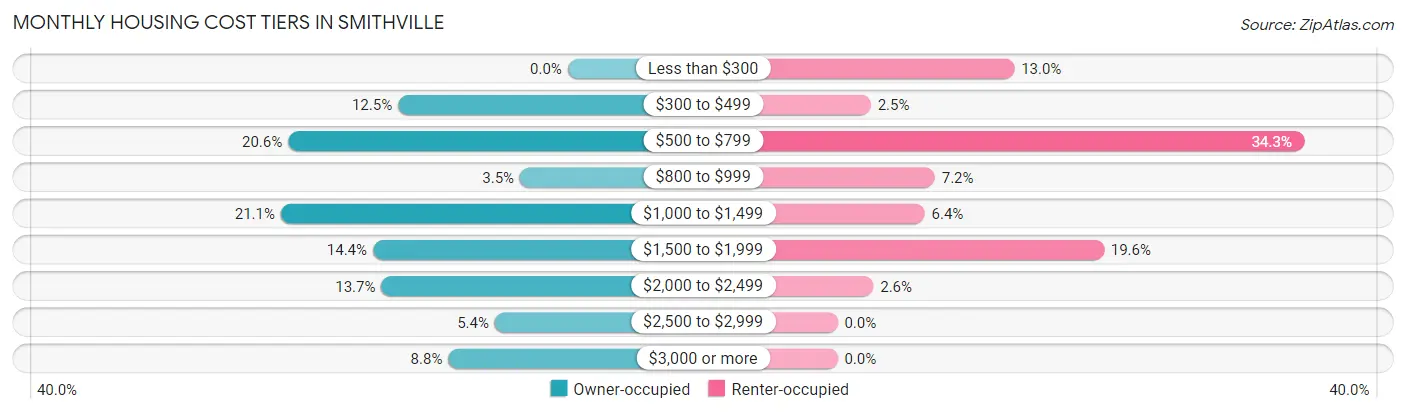
| Monthly Cost | Owner-occupied | Renter-occupied |
| Less than $300 | 0 (0.0%) | 69 (13.0%) |
| $300 to $499 | 142 (12.5%) | 13 (2.5%) |
| $500 to $799 | 234 (20.6%) | 182 (34.3%) |
| $800 to $999 | 40 (3.5%) | 38 (7.2%) |
| $1,000 to $1,499 | 240 (21.1%) | 34 (6.4%) |
| $1,500 to $1,999 | 163 (14.3%) | 104 (19.6%) |
| $2,000 to $2,499 | 156 (13.7%) | 14 (2.6%) |
| $2,500 to $2,999 | 61 (5.4%) | 0 (0.0%) |
| $3,000 or more | 100 (8.8%) | 0 (0.0%) |
| Total | 1,136 (100.0%) | 530 (100.0%) |
Physical Housing Characteristics in Smithville
Housing Structures in Smithville
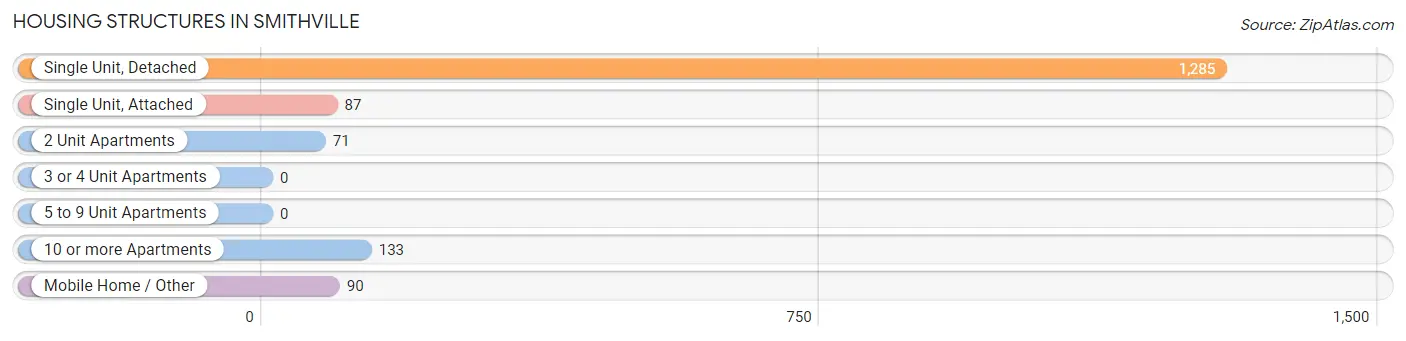
| Structure Type | # Housing Units | % Housing Units |
| Single Unit, Detached | 1,285 | 77.1% |
| Single Unit, Attached | 87 | 5.2% |
| 2 Unit Apartments | 71 | 4.3% |
| 3 or 4 Unit Apartments | 0 | 0.0% |
| 5 to 9 Unit Apartments | 0 | 0.0% |
| 10 or more Apartments | 133 | 8.0% |
| Mobile Home / Other | 90 | 5.4% |
| Total | 1,666 | 100.0% |
Housing Structures by Occupancy in Smithville
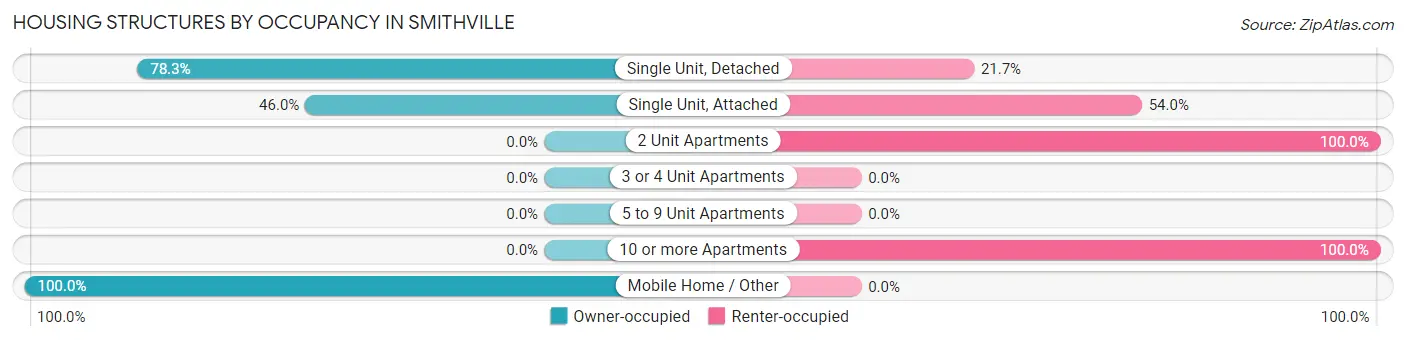
| Structure Type | Owner-occupied | Renter-occupied |
| Single Unit, Detached | 1,006 (78.3%) | 279 (21.7%) |
| Single Unit, Attached | 40 (46.0%) | 47 (54.0%) |
| 2 Unit Apartments | 0 (0.0%) | 71 (100.0%) |
| 3 or 4 Unit Apartments | 0 (0.0%) | 0 (0.0%) |
| 5 to 9 Unit Apartments | 0 (0.0%) | 0 (0.0%) |
| 10 or more Apartments | 0 (0.0%) | 133 (100.0%) |
| Mobile Home / Other | 90 (100.0%) | 0 (0.0%) |
| Total | 1,136 (68.2%) | 530 (31.8%) |
Housing Structures by Number of Rooms in Smithville
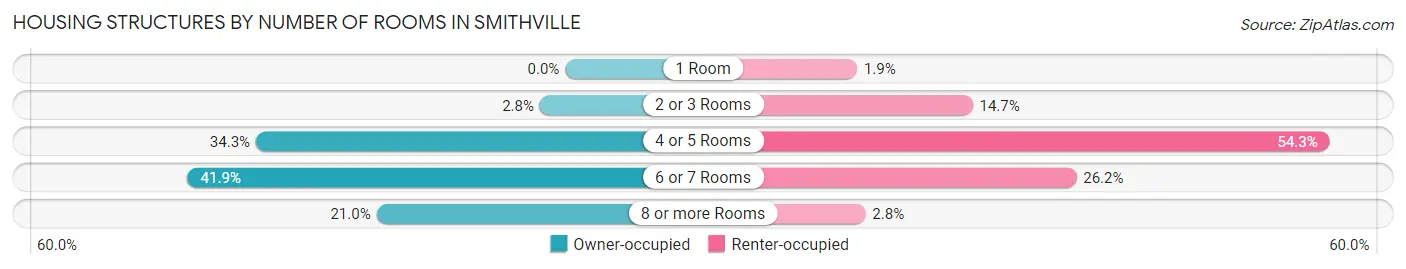
| Number of Rooms | Owner-occupied | Renter-occupied |
| 1 Room | 0 (0.0%) | 10 (1.9%) |
| 2 or 3 Rooms | 32 (2.8%) | 78 (14.7%) |
| 4 or 5 Rooms | 390 (34.3%) | 288 (54.3%) |
| 6 or 7 Rooms | 476 (41.9%) | 139 (26.2%) |
| 8 or more Rooms | 238 (20.9%) | 15 (2.8%) |
| Total | 1,136 (100.0%) | 530 (100.0%) |
Housing Structure by Heating Type in Smithville
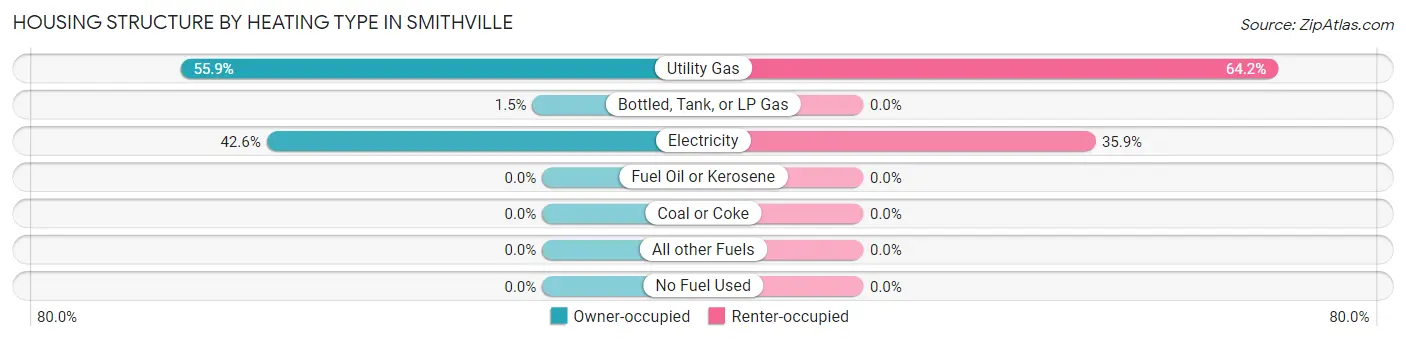
| Heating Type | Owner-occupied | Renter-occupied |
| Utility Gas | 635 (55.9%) | 340 (64.1%) |
| Bottled, Tank, or LP Gas | 17 (1.5%) | 0 (0.0%) |
| Electricity | 484 (42.6%) | 190 (35.8%) |
| Fuel Oil or Kerosene | 0 (0.0%) | 0 (0.0%) |
| Coal or Coke | 0 (0.0%) | 0 (0.0%) |
| All other Fuels | 0 (0.0%) | 0 (0.0%) |
| No Fuel Used | 0 (0.0%) | 0 (0.0%) |
| Total | 1,136 (100.0%) | 530 (100.0%) |
Household Vehicle Usage in Smithville
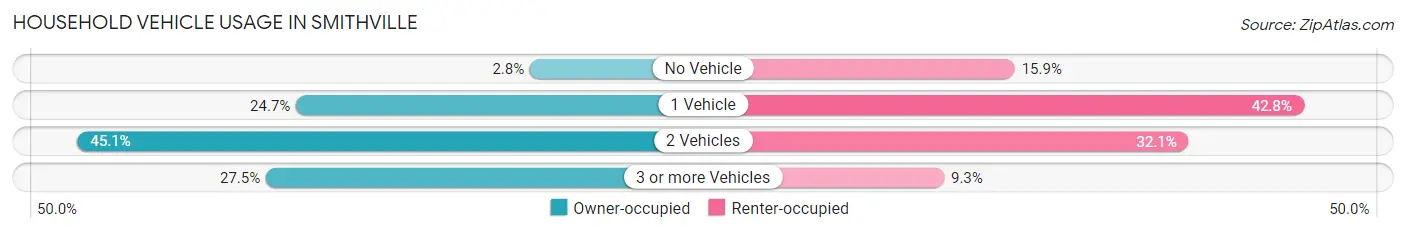
| Vehicles per Household | Owner-occupied | Renter-occupied |
| No Vehicle | 32 (2.8%) | 84 (15.9%) |
| 1 Vehicle | 280 (24.6%) | 227 (42.8%) |
| 2 Vehicles | 512 (45.1%) | 170 (32.1%) |
| 3 or more Vehicles | 312 (27.5%) | 49 (9.2%) |
| Total | 1,136 (100.0%) | 530 (100.0%) |
Real Estate & Mortgages in Smithville
Real Estate and Mortgage Overview in Smithville
| Characteristic | Without Mortgage | With Mortgage |
| Housing Units | 384 | 752 |
| Median Property Value | $201,200 | $234,900 |
| Median Household Income | $58,393 | $234 |
| Monthly Housing Costs | $641 | $100 |
| Real Estate Taxes | $2,678 | $54 |
Property Value by Mortgage Status in Smithville
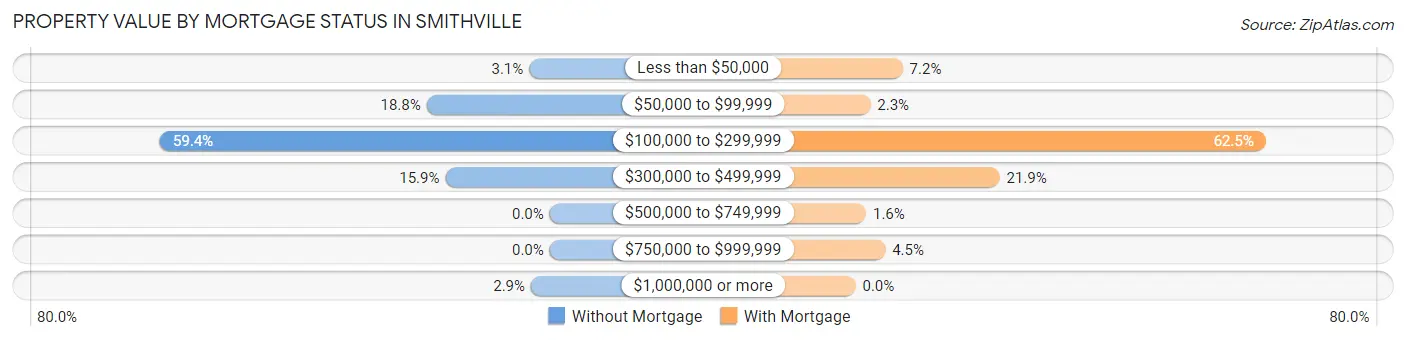
| Property Value | Without Mortgage | With Mortgage |
| Less than $50,000 | 12 (3.1%) | 54 (7.2%) |
| $50,000 to $99,999 | 72 (18.8%) | 17 (2.3%) |
| $100,000 to $299,999 | 228 (59.4%) | 470 (62.5%) |
| $300,000 to $499,999 | 61 (15.9%) | 165 (21.9%) |
| $500,000 to $749,999 | 0 (0.0%) | 12 (1.6%) |
| $750,000 to $999,999 | 0 (0.0%) | 34 (4.5%) |
| $1,000,000 or more | 11 (2.9%) | 0 (0.0%) |
| Total | 384 (100.0%) | 752 (100.0%) |
Household Income by Mortgage Status in Smithville
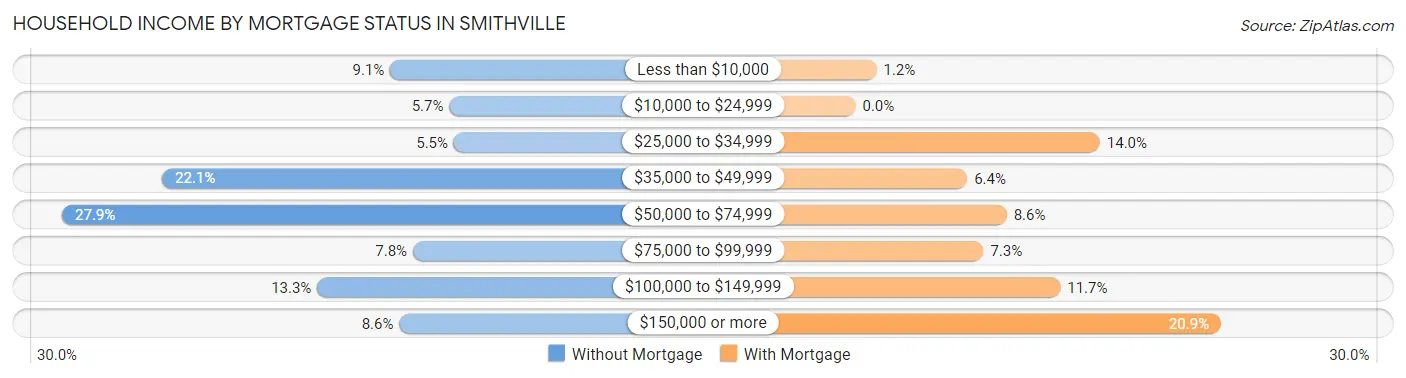
| Household Income | Without Mortgage | With Mortgage |
| Less than $10,000 | 35 (9.1%) | 9 (1.2%) |
| $10,000 to $24,999 | 22 (5.7%) | 0 (0.0%) |
| $25,000 to $34,999 | 21 (5.5%) | 105 (14.0%) |
| $35,000 to $49,999 | 85 (22.1%) | 48 (6.4%) |
| $50,000 to $74,999 | 107 (27.9%) | 65 (8.6%) |
| $75,000 to $99,999 | 30 (7.8%) | 55 (7.3%) |
| $100,000 to $149,999 | 51 (13.3%) | 88 (11.7%) |
| $150,000 or more | 33 (8.6%) | 157 (20.9%) |
| Total | 384 (100.0%) | 752 (100.0%) |
Property Value to Household Income Ratio in Smithville
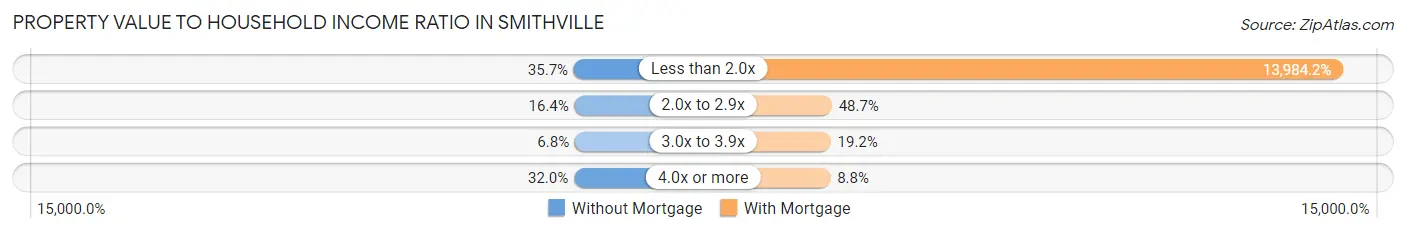
| Value-to-Income Ratio | Without Mortgage | With Mortgage |
| Less than 2.0x | 137 (35.7%) | 105,161 (13,984.2%) |
| 2.0x to 2.9x | 63 (16.4%) | 366 (48.7%) |
| 3.0x to 3.9x | 26 (6.8%) | 144 (19.2%) |
| 4.0x or more | 123 (32.0%) | 66 (8.8%) |
| Total | 384 (100.0%) | 752 (100.0%) |
Real Estate Taxes by Mortgage Status in Smithville
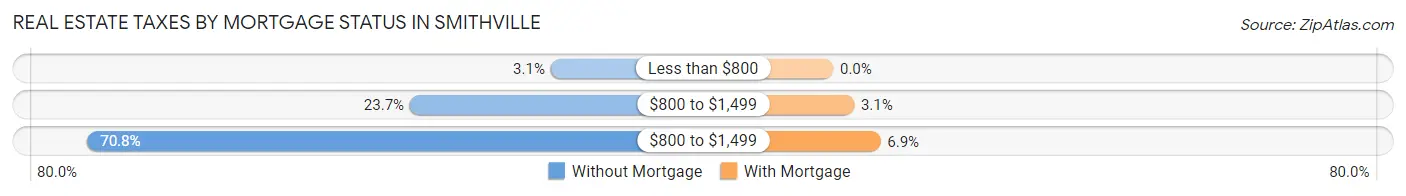
| Property Taxes | Without Mortgage | With Mortgage |
| Less than $800 | 12 (3.1%) | 0 (0.0%) |
| $800 to $1,499 | 91 (23.7%) | 23 (3.1%) |
| $800 to $1,499 | 272 (70.8%) | 52 (6.9%) |
| Total | 384 (100.0%) | 752 (100.0%) |
Health & Disability in Smithville
Health Insurance Coverage by Age in Smithville
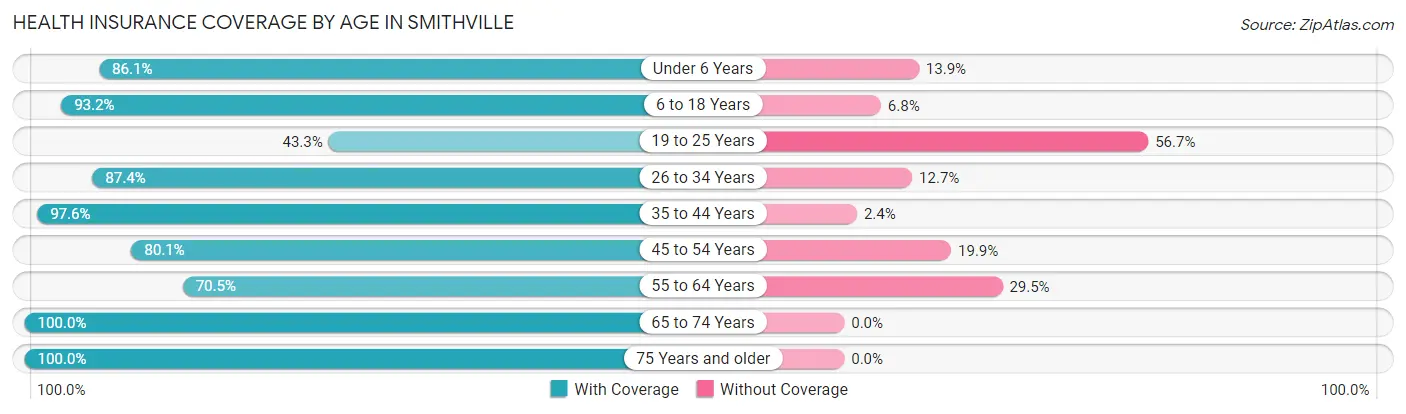
| Age Bracket | With Coverage | Without Coverage |
| Under 6 Years | 198 (86.1%) | 32 (13.9%) |
| 6 to 18 Years | 505 (93.2%) | 37 (6.8%) |
| 19 to 25 Years | 94 (43.3%) | 123 (56.7%) |
| 26 to 34 Years | 359 (87.4%) | 52 (12.7%) |
| 35 to 44 Years | 539 (97.6%) | 13 (2.4%) |
| 45 to 54 Years | 635 (80.1%) | 158 (19.9%) |
| 55 to 64 Years | 251 (70.5%) | 105 (29.5%) |
| 65 to 74 Years | 435 (100.0%) | 0 (0.0%) |
| 75 Years and older | 399 (100.0%) | 0 (0.0%) |
| Total | 3,415 (86.8%) | 520 (13.2%) |
Health Insurance Coverage by Citizenship Status in Smithville
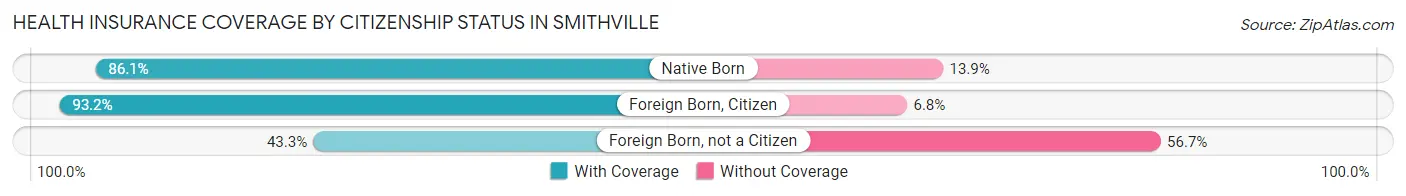
| Citizenship Status | With Coverage | Without Coverage |
| Native Born | 198 (86.1%) | 32 (13.9%) |
| Foreign Born, Citizen | 505 (93.2%) | 37 (6.8%) |
| Foreign Born, not a Citizen | 94 (43.3%) | 123 (56.7%) |
Health Insurance Coverage by Household Income in Smithville
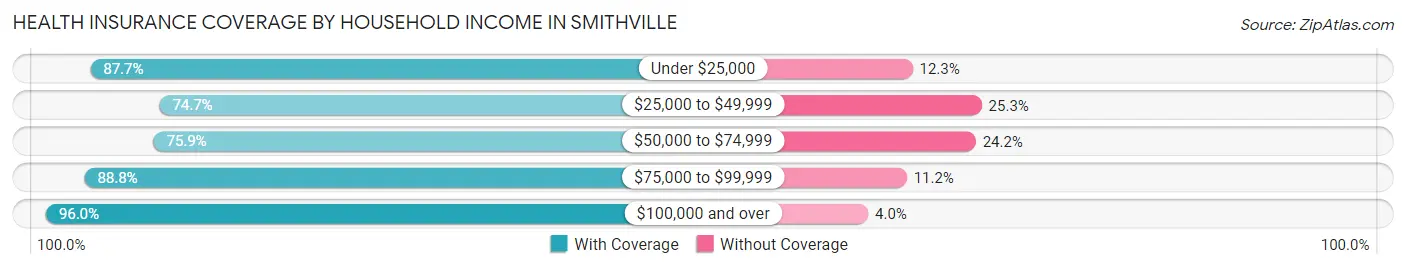
| Household Income | With Coverage | Without Coverage |
| Under $25,000 | 342 (87.7%) | 48 (12.3%) |
| $25,000 to $49,999 | 754 (74.7%) | 255 (25.3%) |
| $50,000 to $74,999 | 355 (75.8%) | 113 (24.1%) |
| $75,000 to $99,999 | 269 (88.8%) | 34 (11.2%) |
| $100,000 and over | 1,683 (96.0%) | 70 (4.0%) |
Public vs Private Health Insurance Coverage by Age in Smithville
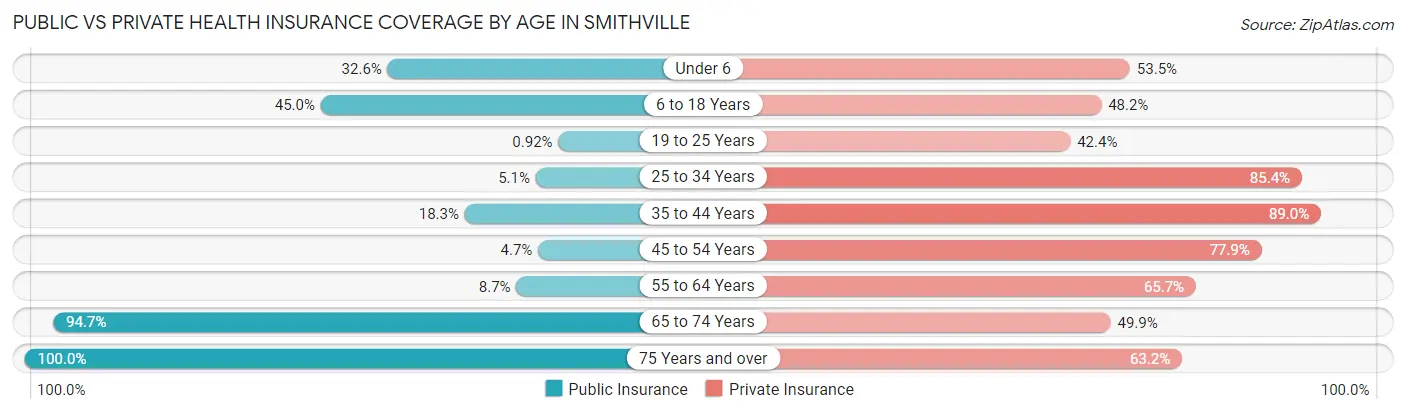
| Age Bracket | Public Insurance | Private Insurance |
| Under 6 | 75 (32.6%) | 123 (53.5%) |
| 6 to 18 Years | 244 (45.0%) | 261 (48.1%) |
| 19 to 25 Years | 2 (0.9%) | 92 (42.4%) |
| 25 to 34 Years | 21 (5.1%) | 351 (85.4%) |
| 35 to 44 Years | 101 (18.3%) | 491 (88.9%) |
| 45 to 54 Years | 37 (4.7%) | 618 (77.9%) |
| 55 to 64 Years | 31 (8.7%) | 234 (65.7%) |
| 65 to 74 Years | 412 (94.7%) | 217 (49.9%) |
| 75 Years and over | 399 (100.0%) | 252 (63.2%) |
| Total | 1,322 (33.6%) | 2,639 (67.1%) |
Disability Status by Sex by Age in Smithville
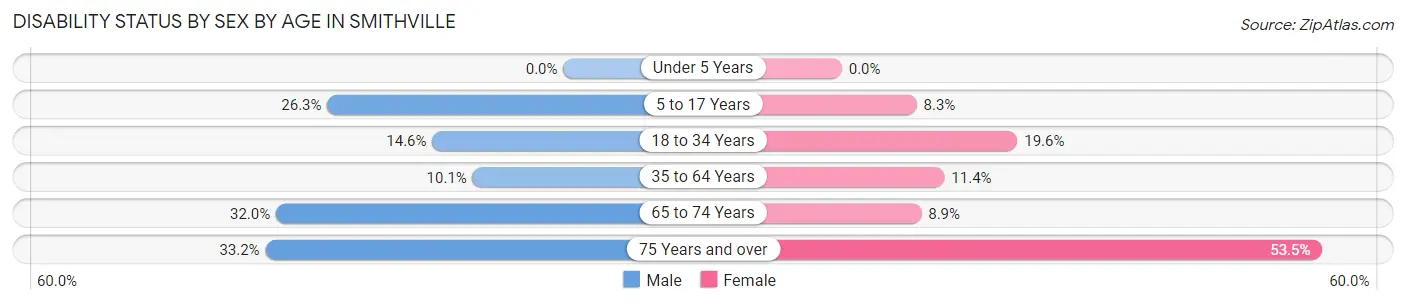
| Age Bracket | Male | Female |
| Under 5 Years | 0 (0.0%) | 0 (0.0%) |
| 5 to 17 Years | 72 (26.3%) | 24 (8.3%) |
| 18 to 34 Years | 41 (14.6%) | 70 (19.6%) |
| 35 to 64 Years | 94 (10.1%) | 88 (11.4%) |
| 65 to 74 Years | 56 (32.0%) | 23 (8.8%) |
| 75 Years and over | 71 (33.2%) | 99 (53.5%) |
Disability Class by Sex by Age in Smithville
Disability Class: Hearing Difficulty
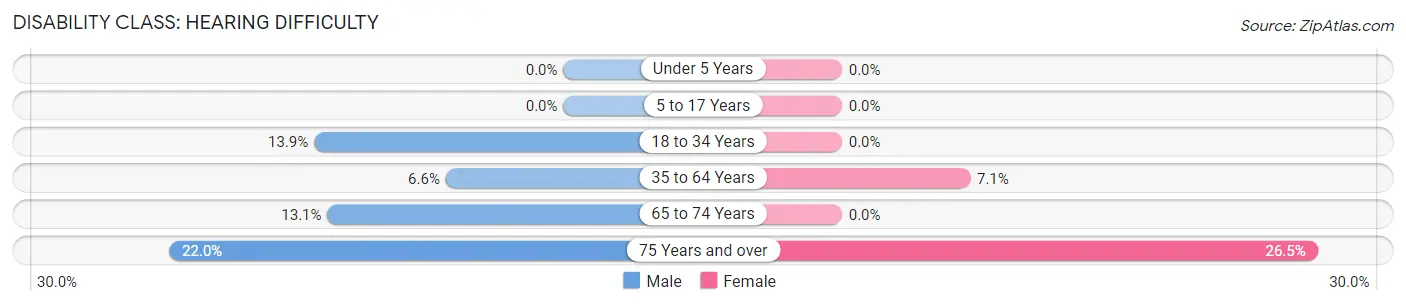
| Age Bracket | Male | Female |
| Under 5 Years | 0 (0.0%) | 0 (0.0%) |
| 5 to 17 Years | 0 (0.0%) | 0 (0.0%) |
| 18 to 34 Years | 39 (13.9%) | 0 (0.0%) |
| 35 to 64 Years | 61 (6.6%) | 55 (7.1%) |
| 65 to 74 Years | 23 (13.1%) | 0 (0.0%) |
| 75 Years and over | 47 (22.0%) | 49 (26.5%) |
Disability Class: Vision Difficulty
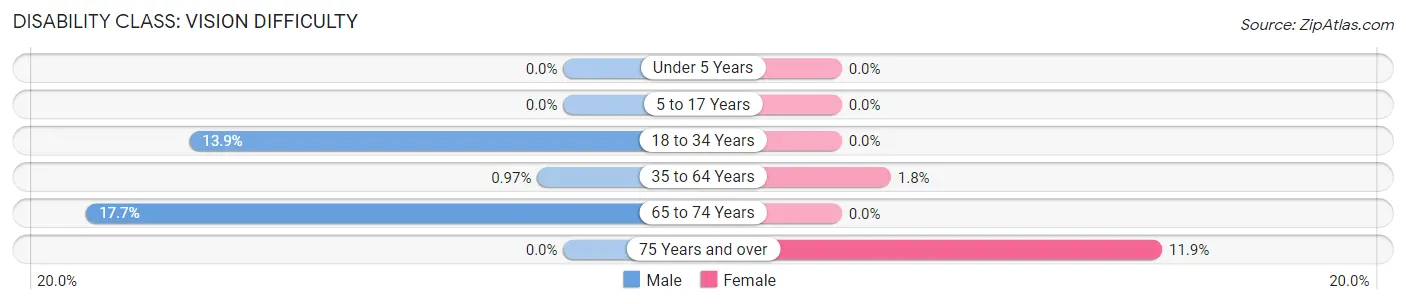
| Age Bracket | Male | Female |
| Under 5 Years | 0 (0.0%) | 0 (0.0%) |
| 5 to 17 Years | 0 (0.0%) | 0 (0.0%) |
| 18 to 34 Years | 39 (13.9%) | 0 (0.0%) |
| 35 to 64 Years | 9 (1.0%) | 14 (1.8%) |
| 65 to 74 Years | 31 (17.7%) | 0 (0.0%) |
| 75 Years and over | 0 (0.0%) | 22 (11.9%) |
Disability Class: Cognitive Difficulty
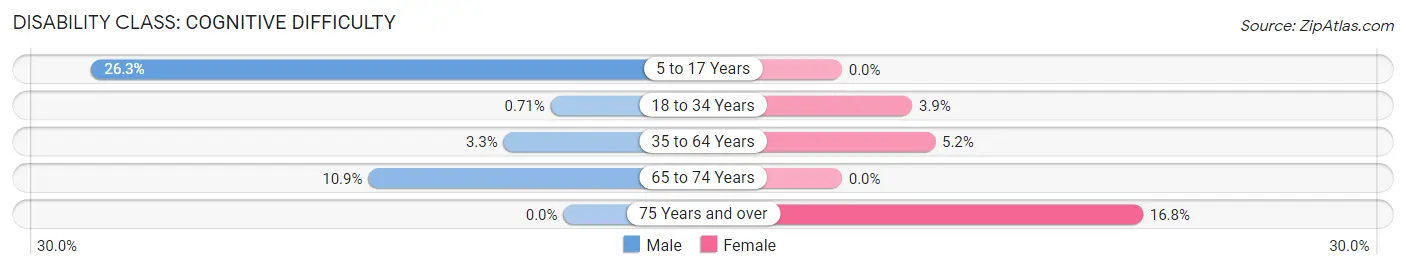
| Age Bracket | Male | Female |
| 5 to 17 Years | 72 (26.3%) | 0 (0.0%) |
| 18 to 34 Years | 2 (0.7%) | 14 (3.9%) |
| 35 to 64 Years | 31 (3.3%) | 40 (5.2%) |
| 65 to 74 Years | 19 (10.9%) | 0 (0.0%) |
| 75 Years and over | 0 (0.0%) | 31 (16.8%) |
Disability Class: Ambulatory Difficulty
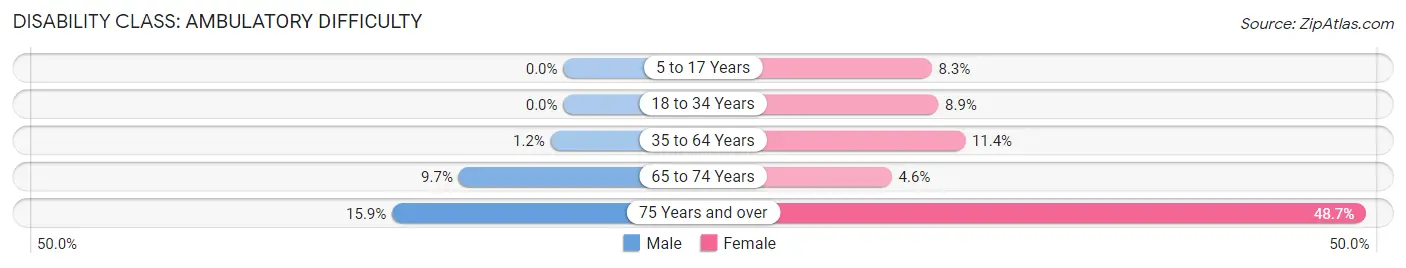
| Age Bracket | Male | Female |
| 5 to 17 Years | 0 (0.0%) | 24 (8.3%) |
| 18 to 34 Years | 0 (0.0%) | 32 (8.9%) |
| 35 to 64 Years | 11 (1.2%) | 88 (11.4%) |
| 65 to 74 Years | 17 (9.7%) | 12 (4.6%) |
| 75 Years and over | 34 (15.9%) | 90 (48.6%) |
Disability Class: Self-Care Difficulty
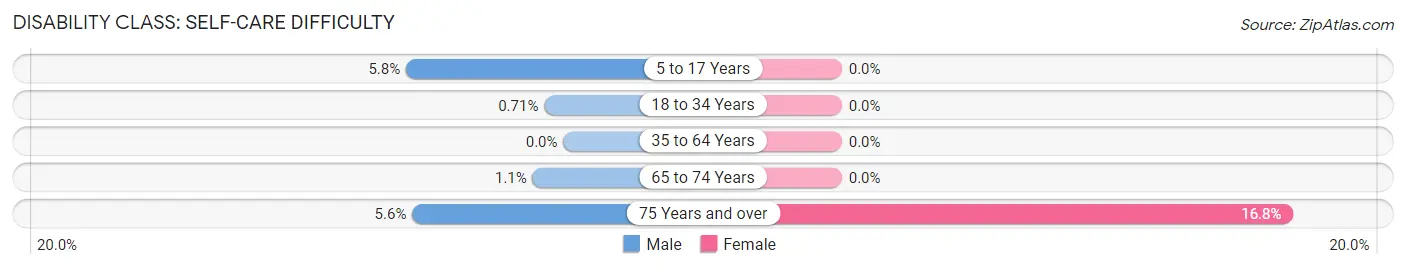
| Age Bracket | Male | Female |
| 5 to 17 Years | 16 (5.8%) | 0 (0.0%) |
| 18 to 34 Years | 2 (0.7%) | 0 (0.0%) |
| 35 to 64 Years | 0 (0.0%) | 0 (0.0%) |
| 65 to 74 Years | 2 (1.1%) | 0 (0.0%) |
| 75 Years and over | 12 (5.6%) | 31 (16.8%) |
Technology Access in Smithville
Computing Device Access in Smithville
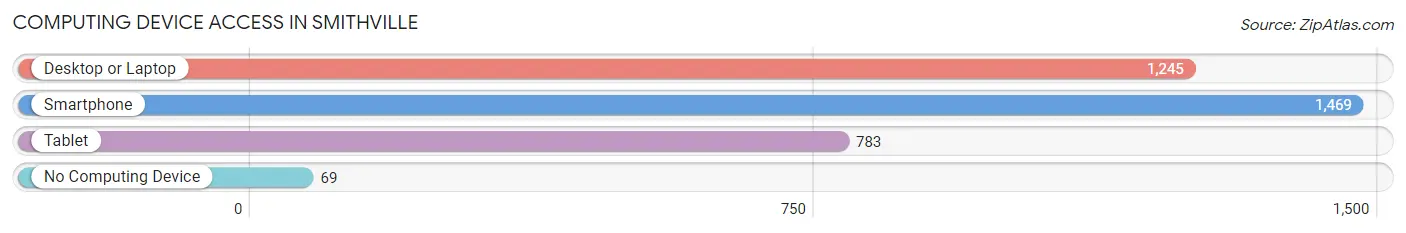
| Device Type | # Households | % Households |
| Desktop or Laptop | 1,245 | 74.7% |
| Smartphone | 1,469 | 88.2% |
| Tablet | 783 | 47.0% |
| No Computing Device | 69 | 4.1% |
| Total | 1,666 | 100.0% |
Internet Access in Smithville
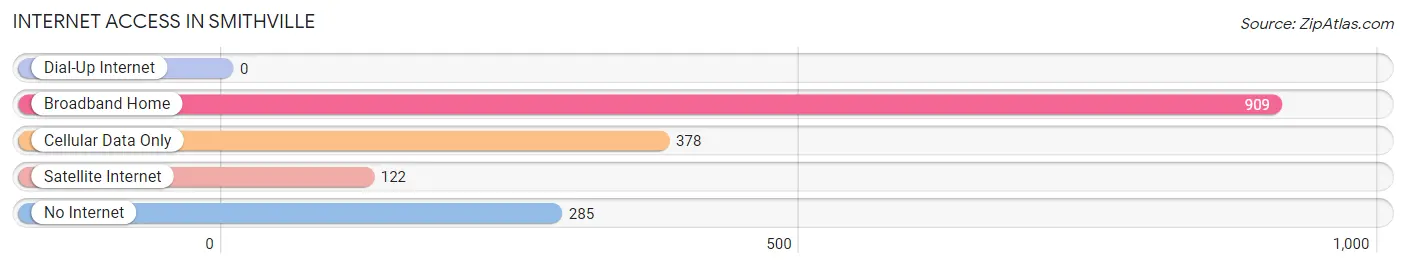
| Internet Type | # Households | % Households |
| Dial-Up Internet | 0 | 0.0% |
| Broadband Home | 909 | 54.6% |
| Cellular Data Only | 378 | 22.7% |
| Satellite Internet | 122 | 7.3% |
| No Internet | 285 | 17.1% |
| Total | 1,666 | 100.0% |
Smithville Summary
History
The small town of Smithville, Texas is located in Bastrop County, about 30 miles east of Austin. It was founded in 1827 by Thomas G. Smith, a veteran of the War of 1812. Smithville was originally known as Smith’s Mill, and was the first settlement in Bastrop County. Smithville was officially incorporated in 1837, and was the county seat until 1858.
The town was a major stop on the Chisholm Trail, and was a popular destination for cowboys and cattle drives. The town was also a major stop on the Houston and Texas Central Railway, which connected Houston to Austin. The railroad brought many new settlers to the area, and the town grew rapidly.
In the late 19th century, Smithville was a thriving center of commerce and industry. The town had several sawmills, gristmills, and cotton gins. The town also had several stores, hotels, and saloons.
In the early 20th century, Smithville was a major center of the timber industry. The town had several sawmills and lumber yards, and was home to several large lumber companies. The town also had several brickyards, and was home to several brick manufacturers.
In the mid-20th century, Smithville began to decline. The timber industry began to decline, and the railroad stopped running through the town. The town’s population began to decline, and many of the businesses closed.
In the late 20th century, Smithville began to experience a resurgence. The town was designated as a National Historic District in 1976, and many of the historic buildings were restored. The town also began to attract new businesses, and the population began to grow again.
Geography
Smithville is located in Bastrop County, about 30 miles east of Austin. The town is situated on the Colorado River, and is surrounded by rolling hills and wooded areas. The town is located in the Central Texas Hill Country, and is known for its scenic beauty.
The climate in Smithville is mild and temperate. The average temperature in the summer is around 80 degrees Fahrenheit, and the average temperature in the winter is around 50 degrees Fahrenheit. The town receives an average of 35 inches of rain per year.
Economy
The economy of Smithville is largely based on tourism and retail. The town is home to several antique stores, art galleries, and specialty shops. The town also has several restaurants, cafes, and bars.
Smithville is also home to several manufacturing companies, including a furniture manufacturer and a metal fabrication company. The town is also home to several small businesses, including a printing company and a landscaping company.
Demographics
As of the 2010 census, the population of Smithville was 3,817. The population is largely white (83.3%), with a small Hispanic population (14.2%). The median household income is $41,945, and the median home value is $133,400.
The town is served by the Smithville Independent School District. The town is also home to several churches, including the First United Methodist Church and the Smithville Baptist Church.
Conclusion
Smithville, Texas is a small town located in Bastrop County, about 30 miles east of Austin. The town was founded in 1827, and was a major stop on the Chisholm Trail and the Houston and Texas Central Railway. The town was a major center of the timber industry in the late 19th century, and experienced a resurgence in the late 20th century. The town is now largely based on tourism and retail, and has a population of 3,817.
Common Questions
What is Per Capita Income in Smithville?
Per Capita income in Smithville is $40,839.
What is the Median Family Income in Smithville?
Median Family Income in Smithville is $83,750.
What is the Median Household income in Smithville?
Median Household Income in Smithville is $56,627.
What is Income or Wage Gap in Smithville?
Income or Wage Gap in Smithville is 27.5%.
Women in Smithville earn 72.5 cents for every dollar earned by a man.
What is Inequality or Gini Index in Smithville?
Inequality or Gini Index in Smithville is 0.49.
What is the Total Population of Smithville?
Total Population of Smithville is 3,975.
What is the Total Male Population of Smithville?
Total Male Population of Smithville is 1,990.
What is the Total Female Population of Smithville?
Total Female Population of Smithville is 1,985.
What is the Ratio of Males per 100 Females in Smithville?
There are 100.25 Males per 100 Females in Smithville.
What is the Ratio of Females per 100 Males in Smithville?
There are 99.75 Females per 100 Males in Smithville.
What is the Median Population Age in Smithville?
Median Population Age in Smithville is 45.7 Years.
What is the Average Family Size in Smithville
Average Family Size in Smithville is 2.9 People.
What is the Average Household Size in Smithville
Average Household Size in Smithville is 2.4 People.
How Large is the Labor Force in Smithville?
There are 2,286 People in the Labor Forcein in Smithville.
What is the Percentage of People in the Labor Force in Smithville?
69.6% of People are in the Labor Force in Smithville.
What is the Unemployment Rate in Smithville?
Unemployment Rate in Smithville is 4.5%.